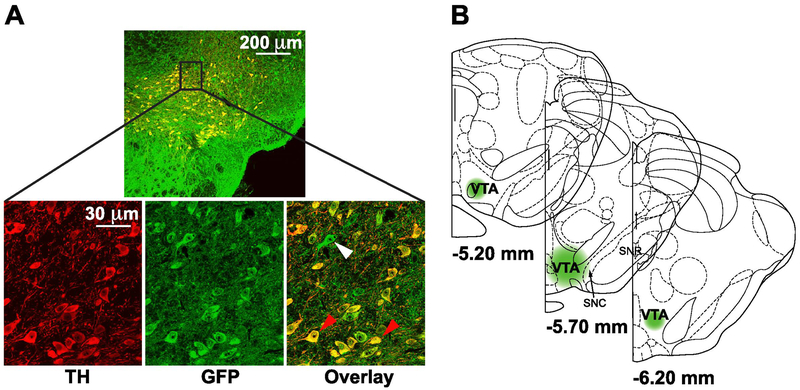
Figure 1.
A. Representative images of immunofluorescence staining for TH (red), GFP (green), and an overlay (yellow) of both markers in the VTA of a rat infected with lentivirus. Red arrows in the overlay image indicate putative dopamine cells double-labeled for TH and GFP. White arrow indicates a virally-infected non-dopaminergic cell. B. Schematic of rat brain sections at the level of the VTA showing the approximate extent of viral transduction. SNC, substantia nigra compacta; SNR, substantia nigra reticulata; VTA, ventral tegmental area.

