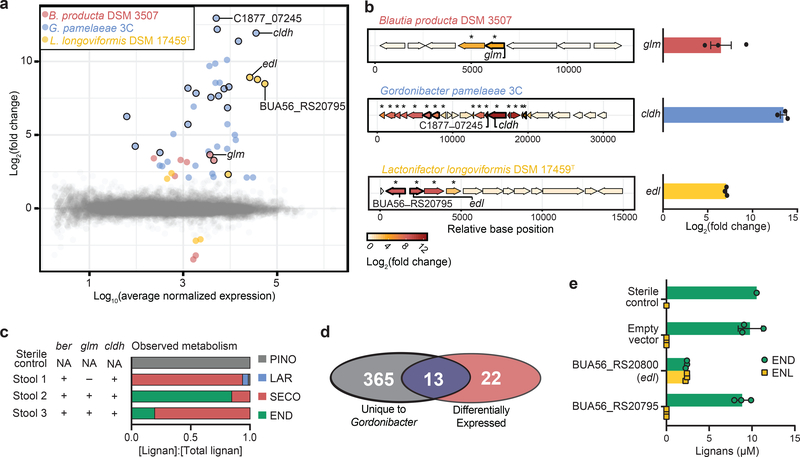
Figure 2. Genomic loci are up-regulated in response to each substrate in the lignan metabolism pathway.
a, Plot of RNAseq results observed from the exposure of B. producta DSM3507 to SECO, G. pamelaeae 3C to dmSECO, and L. longoviformis DSM17459T to END (n=3 biologically independent samples per organism) relative to respective vehicle exposures (n=3 biologically independent samples per organism). Colored points have a fold-change>|4| and FDR<0.01 (Wald test, Benjamini–Hochberg multiple testing correction). Points encircled with black designate clusters of genes that are represented in the locus diagrams in Fig. 2b. b, The most up-regulated genomic loci in B. producta DSM3507, G. pamelaeae 3C, and L. longoviformis DSM17459T. Genes that are outlined in bold demonstrate homology to enzymes (Supplementary Table 3). The genes implicated in lignan-metabolizing biotransformations are annotated: guaiacol lignan methyltransferase (glm), catechol lignan dehydroxylase (cldh), enterodiol lactonizing enzyme (edl). Asterisks denote that the gene is up-regulated in the presence of lignan (n=3 biologically independent samples) relative to vehicle (n=3 biologically independent samples) with a fold-change>|4| and FDR<0.01. Up-regulation of glm, cldh, and edl upon exposure to respective lignan substrates relative to vehicle was confirmed through RT-qPCR (bar is mean±SEM, n=3 biologically independent samples). c, Gene presence of ber, glm, and cldh (assessed by PCR) in human stool samples. Plot of metabolism resulting from ex vivo incubation of human stool samples with PINO for 7 days. d, Venn diagram showing the overlap between genes implicated in dmSECO metabolism by comparative genomics and RNA sequencing (reanalyzed using alternate gene-calling methodology, see Methods). e, Incubation of END (10 μM) with E. coli Rosetta 2(DE3) expressing Edl on a pET151/D-TOPO plasmid. END and ENL were quantified by mass spectrometry (bars are mean±SEM, n=3 biologically independent samples).

