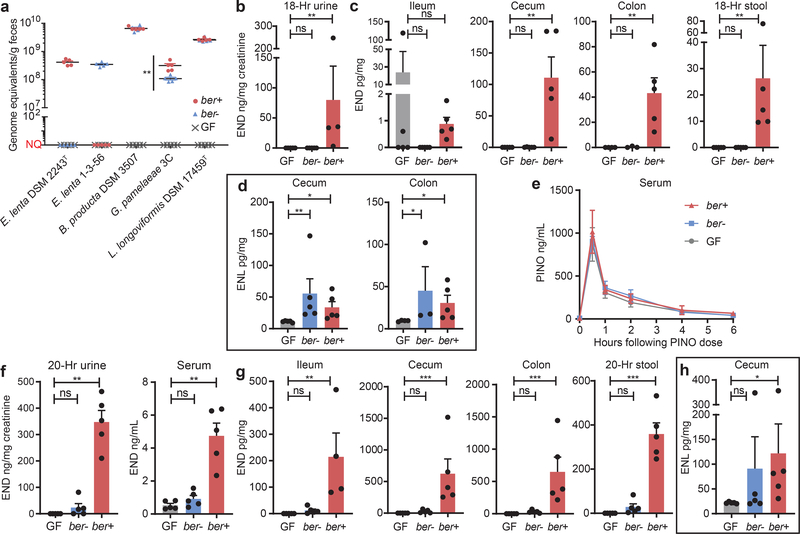
Figure 3. Ber significantly alters enterolignan production in gnotobiotic mice.
a, Mouse bacterial colonization levels were assessed by qPCR. Genome equivalents not detected or below the limit of quantitation (3×10² genome equivalents) are represented as NQ (not quantifiable). Center lines are mean±SEM (n=5 biologically independent samples). Mann-Whitney test for significance: **p=0.0079, two-tailed. b-h, Lignan levels in mice dosed with b-e, PINO (10 mg/kg) or f-h, PINO-diglucoside (20 mg/kg) measured by Orbitrap mass spectrometry. Panels b,c,f,g represent END levels. Panels d,h represent ENL levels. Panel e represents PINO levels. Values are mean±SEM (n=5 biologically independent samples/colonization group with the following exceptions: b-e, 18-hr urine (ber+, n= 4 biologically independent samples), colon (GF, n=4 biologically independent samples; ber−, n=3 biologically independent samples), and serum at 6-hr timepoint (ber+, n= 4 biologically independent samples); g, ileum (ber+, n= 4 biologically independent samples). Kruskal-Wallis with Dunn’s multiple comparisons test: *p<0.05, **p<0.01, ***p<0.001. ns: not statistically significant. ber+ and ber−: germ-free mice colonized with E. lenta DSM2243T (ber+ group) or E. lenta 1–3-56 (ber− group) and B. producta DSM3507, G. pamelaeae 3C, and L. longoviformis DSM17459T; mice dosed with PINO-diglucoside were also colonized with C. saccharogumia DSM17460T. GF: germ-free mice.

