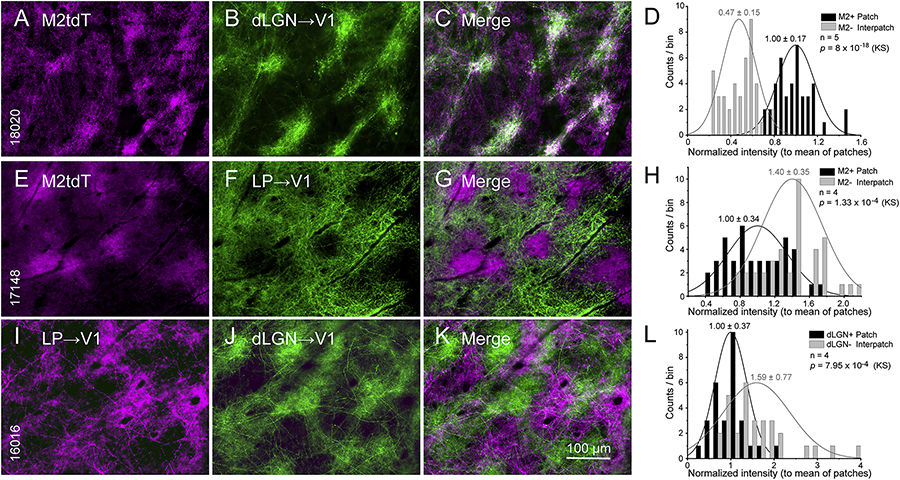
Figure 1. Patchy dLGN→V1 and LP→V1 projections to L1.
Tangential sections through L1 of V1 of Chrm2tdT (A-C, E-G) and C57BL/6J mice (I-K). (A-C) Spatially clustered dLGN→V1 projections anterogradely traced with AAV2/1.hSyn.EGFP (green) overlap with M2tdT+ patches (purple). (D) Normalized fluorescence intensity of dLGN→V1 input to M2tdT+ patches (for contour maps, Figure S1) is higher than to M2tdT-interpatches. (E-G) Patchy LP→V1 projections traced with AAV2/1.hSyn.EGFP (green) overlap with M2tdT- interpatches. (H) Normalized fluorescence intensity of LP inputs to M2tdT-interpatches is higher than to M2tdT+ patches. (I-K) Interdigitating patchy LP→V1 and dLGN→V1 projections traced in the same mouse with AAV2/1hSyn.tdTomato (purple) and AAV2/1.hSyn.EGFP (green), respectively. (L) LP→V1 input is weaker in dLGN+ patches (proxies of M2tdT+ patches; A-C) than in dLGN- interpatches. Mean ± SD, KS (Kolmogorov-Smirnov test), N = number of mice.

