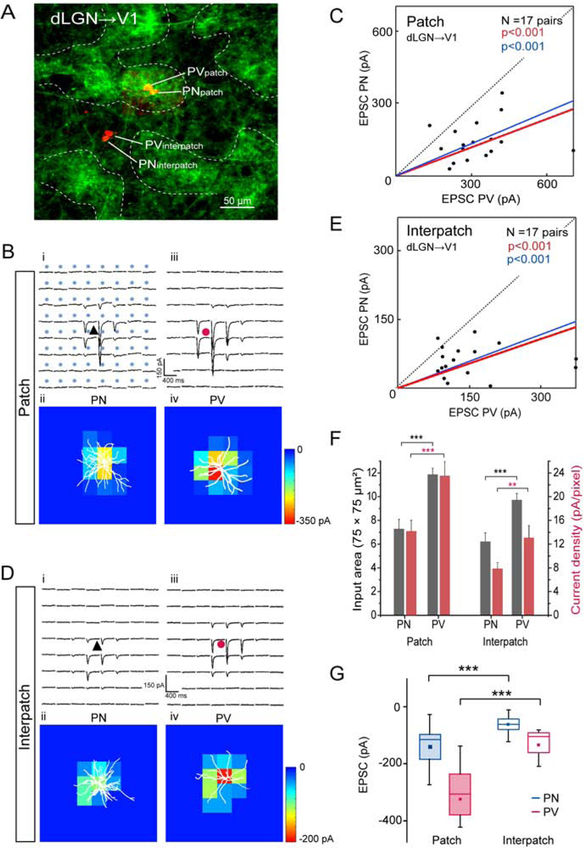
Figure 3. Tangential slices: sCRACM of dLGN→V1 input to L1 onto L2/3 PNs and PVs in patches and interpatches.
(A) Confocal Z-stack showing ChR2-Venus labeled dLGN→V1 projections in L1 and Alexa 594 hydrazide-filled pairs of L2/3 PNs and PVs in patch and interpatch. (B, D) Whole cell patch clamp recordings from PN (black triangle) and PV (red circle) in patches and interpatches in the same slice. Each trace represents average of EPSCs (3 to 5 per neuron) of PNs and PVs in patches (Bi, Biii) and interpatches (Di, Diii) upon laser stimulation (blue dots, 75 × 75 μm grid) of ChR2-expressing dLGN→V1 terminals. Heatmaps of responses evoked at different locations of the dendritic arbor (white profiles) of PN and PV in patches (Bii, Biv) and interpatches (Dii, Div). (C, E) Each dot represents relative strength of dLGN→V1 input (summed pixels of significant EPSCs) of a pair of L2/3 PNs and PVs in patch (C) and interpatch (E). Red line denotes mean slope from zero, blue line shows mean slope after normalizing currents to mean conductance. (F) Distribution of dLGN→V1 input strength across dendritic tree. Grey bars represent input area as number of pixels with non-zero EPSCs. Red bars EPSC density. (G) Box plots of dLGN→V1 EPSCs from PVs and PNs in patches and interpatches. (C, E, F) Wilcoxon signed-rank test (Wt) (***p < 0.001, **p < 0.01).

