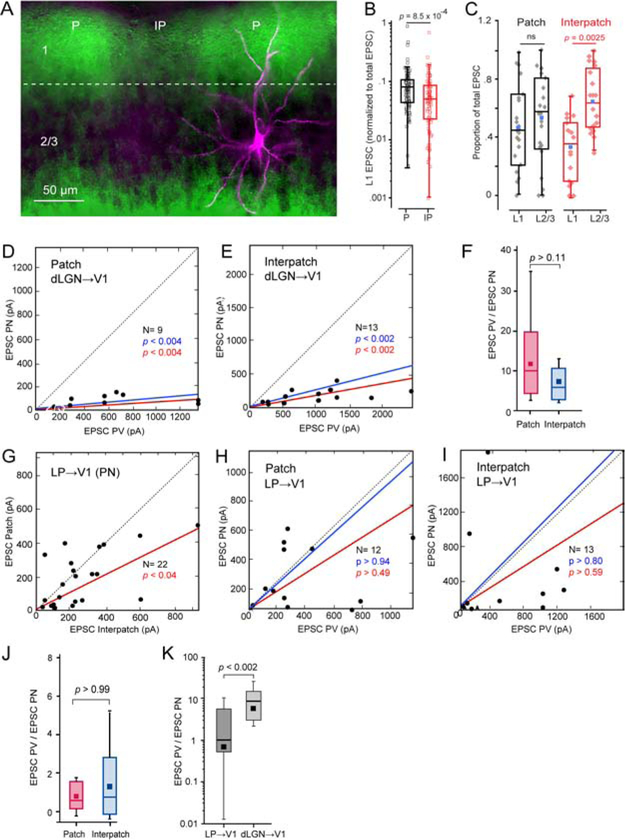
Figure 4. Coronal slices: sCRACM of dLGN→V1 and LP→V1 input to L2/3 PNs and PVs in patches and interpatches.
(A) dLGN→V1 projections (green) traced with AAV2/1.hSyn.ChR2(H134R).EYFP, showing dense terminations in patches (P) and sparse input to interpatches (IP) in L1. Biocytin-filled L2/3 PN (magenta) recorded in patch, showing apical dendrites projecting to patch and basal dendrites descending to uniformly labeled dLGN-recipient deep L2/3. (B) Box plots of recordings from L2/3 PNs showing that EPSCs in L1 (normalized to total EPSCs) in IP (N = 20) are significantly smaller than in P (N = 23). (C) Box plots of recordings from L2/3 PNs showing that the proportion of EPSCs (normalized to total EPSC) in L1 of interpatches is smaller (N = 20, p = 0.0025, paired t-test) than in L2/3. No significant (ns) laminar differences in patches (N = 23). Blue dot denotes mean L1 or L2/3 EPSC. (D, E) Relative strengths of EPSCs from neighboring pairs of L2/3 PNs and PVs evoked by dLGN→V1 input. Recordings from patches (D) and interpatches (E) obtained in different slices. Mean slope of currents from zero (red), slope after normalization to conductance (blue). (F) Similar EPSCPV/EPSCPN ratio in patches and interpatches. (G) EPSCs evoked by LP→V1 input to pairs of neighboring PNs (dots) in patches and interpatches recorded in the same slice, showing stronger inputs to interpatches. (H, I) EPSCs evoked by LP→V1 inputs to pairs of PNs and PVs in patches and interpatches recorded in different slices, showing similar inputs to PNs and PVs. (J) EPSCPV/EPSCPN ratio in patches and interpatches. (K) EPSCPV/EPSCPN ratio evoked by stimulation of dLGN→V1 and LP→V1 axons. Pooled responses from patches and interpatches.

