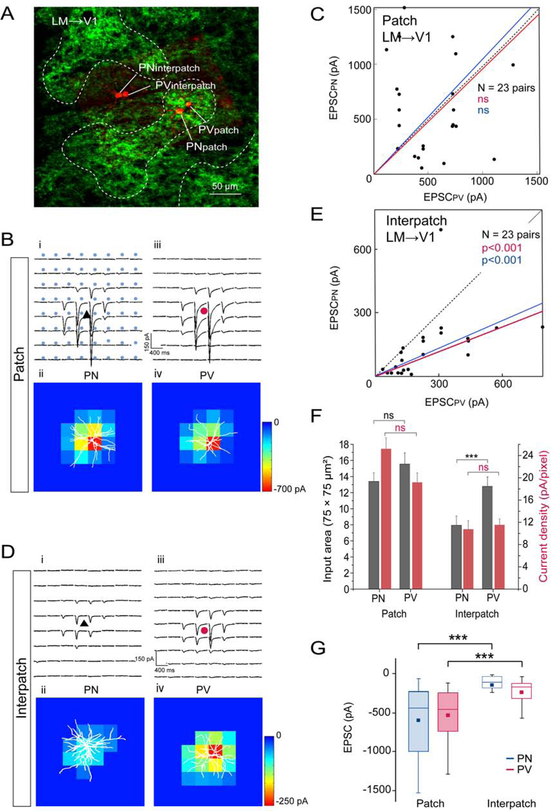
Figure 5. Tangential slices: sCRACM of LM→V1 input to L1 onto L2/3 PNs and PVs in patches and interpatches.
(A) Venus labeled LM→V1 projections in L1 and Alexa 594 hydrazide-filled pairs of L2/3 PNs and PVs in patch and interpatch. (B, D) Whole cell patch clamp recordings in the same slice. Each trace represents average of EPSCs evoked by laser stimulation of ChR2-expressing LM→V1 terminals recorded from PNs and PVs in patches (Bi, Biii) and interpatches (Di, Diii). Heatmaps of responses from PN and PV in patches (Bii, Biv) and interpatches (Dii, Div). (C, E) Dots represent relative strength of LM→V1 input to a pair of L2/3 PNs and PV in patches (C) and interpatches (E). (F) Distribution of LM→V1 input strength across dendritic tree of PNs and PVs in patches and interpatches. Grey bars denote input areas, red bars represent current densities. (G) Box plots of strength of LM→V1-evoked EPSCs from PVs and PNs in patches and interpatches. (C, E, F, G). Wt (***p < 0.001, ns = not significant). Same conventions as in Figure 3.

