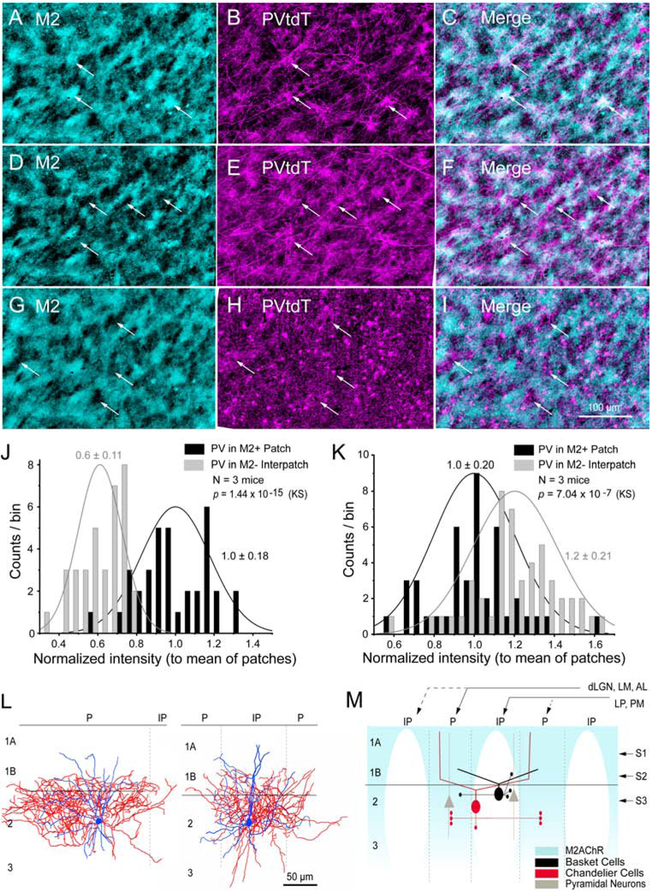
Figure 6. Clustering of PV neurons in V1.
(A-C) Tangential 40 μm section through V1 at 40 μm below pial surface (see, S1 in M) showing overlapping pattern of immunolabeled M2+ patches (cyan, arrows) with PVtdT processes (magenta). (D-F) Section ~80 μm below surface (see, S2 in M; section aligned to A) showing overlapping pattern (arrows) of PV processes with M2− interpatches. (G-I) Section ~120 μm below surface (see, S3 in M; aligned to B) showing overlapping pattern (arrows) of PV cell bodies, dendrites and boutons with M2− interpatches. (J) Normalized PVtdT intensity (to mean intensity in patches) in L1A showing higher PV in patches. (K) Normalized PVtdT intensity (to mean intensity in patches) in L2 showing higher PV in interpatches. (J, K) KS, mean ± SD. (L) Biocytin-filled L2/3 PV+ BCs (coronal plane) showing that dendrites (blue) branch in L1B-2. Axons (red) of cells in patches (P, left panel) and interpatches (IP, right panel) branch near the cell body with little spread to neighboring IPs or Ps, respectively. Left panel shows patch-cell with asymmetrical axon arbor, largely contained within P. Elongated shape of axonal arbor is due to oblique section angle across P. PVs are less frequent in P. (M) Diagram of coronal section. Strong (solid lines) dLGN→V1, LM→V1, AL→V1 inputs to M2+ Ps (blue). Strong LP→V1, PM→V1 inputs to M2− IPs. High density of PV+ BC cell bodies, dendrites, axo-somatic and axo-dendritic boutons in L1B-2 of IPs. Putative PV+ ChC dendrites are denser in Ps and extend to L1A. Dense axo-axonic connections in L2/3 of Ps.

