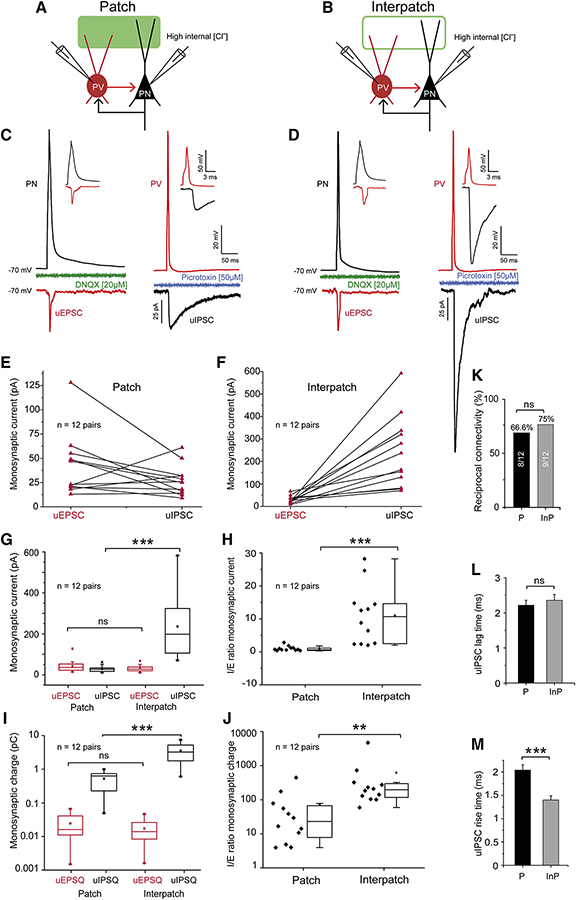
Figure 7. Stronger inhibition in interpatches than patches.
(A, B) Diagram of recordings in coronal slices of unitary uIPSCs and uEPSCs in synaptically reciprocally connected pairs of L2/3 PNs and PVs (PN↔PV) aligned with ChR2.Venus-expressing dLGN→V1 patches (solid green) and interpatches (green outline) in L1. Recordings of inward uIPSCs from PNs with high [Cl−] internal solution at −70 mV holding potential. Recordings from PVs with K-gluconate internal solution. (C, D) uEPSCs (inward red trace) from PVs and uIPSCs (inward black trace) from PNs, after presynaptic spike from PNs or PVs, respectively, in patch (C) and interpatch (D). uEPSC in patches and interpatches have similar amplitudes and are blocked by DNQX (green C, D). In the reverse connection uIPSCs (black trace) in interpatches (D) were larger than in patches (C), and were blocked by Picrotoxin (blue C, D). The insets in (C) and (D) show that in the PV→PN and PV←PN direction postsynaptic responses exhibit monosynaptic delays. (E, F) uEPSCs and uIPSCs recorded in pairs of PNs and PV in patches and interpatches. In most pairs, uIPSCs in interpatches are larger than in patches. (G) Average uEPSCs from reciprocally connected PV↔PN pairs are similar, whereas uIPSCs in interpatches are larger (***p < 0.001). (H) Average I/E ratios of PV↔PN pairs in patches and interpatches. I/E balance in interpatches is tilted toward inhibition (***p < 0.001, paired t-test). (I) Average charge of uEPSCs and uIPSCs in patches and interpatches, showing that excitatory charge transfer at PN→PV contacts in patches and interpatches is similar. In interpatches the inhibitory charge transfer at PV→PN contacts is larger (*** p < 0.001, one-way ANOVA, Bonferroni correction). (J) I/E ratio showing that in reciprocally connected PV↔PN pairs in interpatches, uEPSCs are more strongly (** p < 0.01, two-sample t-test) opposed by uIPSCs. (K) The percentages of the total number of reciprocally connected PV↔PN pairs in patches (Ps) is similar (ns, Chi square test) in patches and interpatches (IPs). (L) The onset latency of uIPSC in Ps and IPs is similar (ns, Chi square test). (M) The rise time of uIPSCs in IPs is faster than in Ps (***p<0.001, paired t-test).

