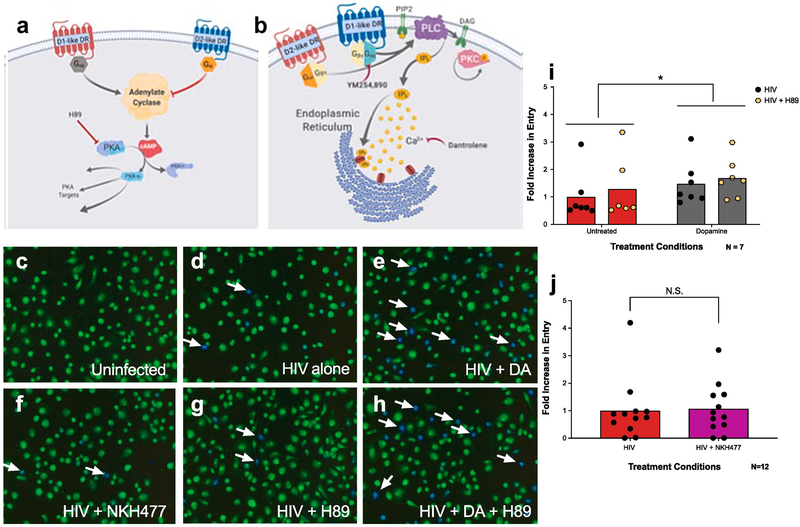
Figure 2 -. Dopamine-mediated increase in HIV entry in macrophages is independent of canonical dopamine signaling.
(A, B) Cartoon depicting the dopaminergic signaling pathways. Canonically (A) D1-like receptors (D1 and D5, blue) couple to Gαs, which activates adenylate cyclase, leading to production of cyclic AMP (cAMP), and activation of PKA and further downstream targets. In contrast, D2-like receptors (D2, D3, and D4, red) couple to Gαi to inhibit adenylate cyclase and oppose D1-like signaling. In the non-canonical pathway (B), the D1-like receptor D5 (blue) couples to Gq/11 while the D2-like receptor D2 (red) couples to Gβγ to activate PLC, which hydrolyzes PIP2 to form IP3 and diacyglycerol (DAG). These second messengers then induce IP3-mediated calcium release from the endoplasmic reticulum, and DAG-mediated PKC activation. Inhibitors used throughout this paper to examine these pathways are depicted by red arrows. To examine whether activation of the canonical pathway modulates the effect of dopamine on HIV entry into MDM, human monocyte derived macrophages (MDM) were pretreated with either vehicle (C-F) or H89 (10−6 M, G, H) for 60 min, then infected with β-lac HIV in the presence or absence of dopamine (10−6 M), or NKH 477 (10−5 M) for 2.5 hours. MDM were then incubated in the dark for 6 hrs and HIV entry was assessed. Representative images are depicted in (C-H). Representative infected cells (blue) are indicated by white arrows. Dopamine treatment had a main effect on HIV entry into MDM (gray columns) relative to cells infected with HIV alone (red columns), while treatment with H89 (yellow hexagons) had no effect on HIV entry of the effect of dopamine (I). Increasing cAMP concentrations using NKH477 (pink column) also did not alter HIV entry into MDM relative to cells infected with HIV alone (red column) (J). Data are represented as fold change compared to the mean of the vehicle treated control *p<0.05

