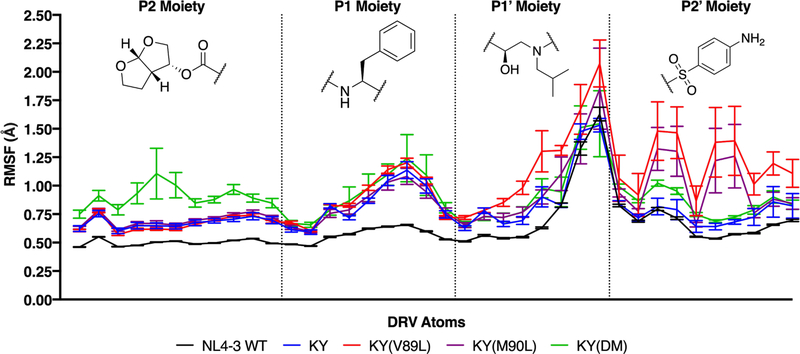
Figure 3.
Increased inhibitor fluctuations correlate with decreased susceptibility. For DRV, the chemical structures of individual moieties shown along with the root-mean-square fluctuations (RMSF) for each of its heavy atoms. Each profile above corresponds to DRV in complex with a different HIV-1 protease variant. Averaging across each of these RMSF profiles gives: 0.63 ± 0.01 Å (NL4–3), 0.79 ± 0.03 Å (KY), 0.97 ± 0.09 Å (KY(V89L)), 0.88 ± 0.09 Å (KY(M90L)), and 0.91 ± 0.07 Å KY(DM).

