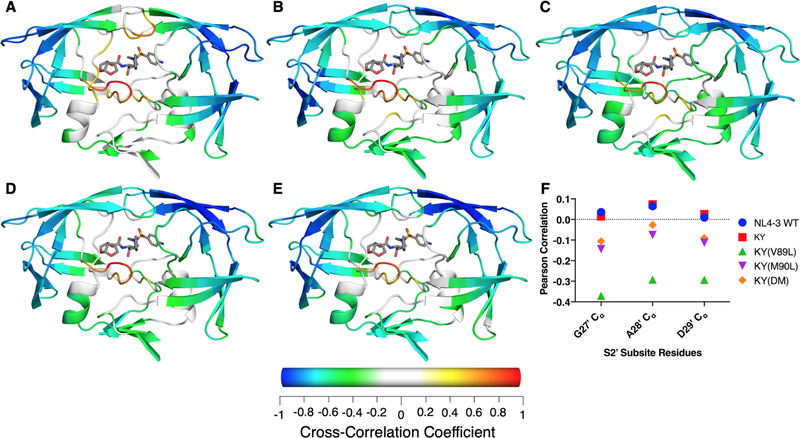
Figure 4.
Average cross-correlation between fluctuations of Cα atoms and all DRV heavy atoms during the MD simulations. (A) NL4–3, (B) KY, (C) KY(V89L), (D) KY(M90L), and (E) KY(DM). Cα atoms with a Pearson correlation coefficient between −0.2 and 0.2 are colored white. (F) Unique to the KY(V89L) variant is an increased negative correlation with residues 27′ to 29′ in the S2′ subsite.

