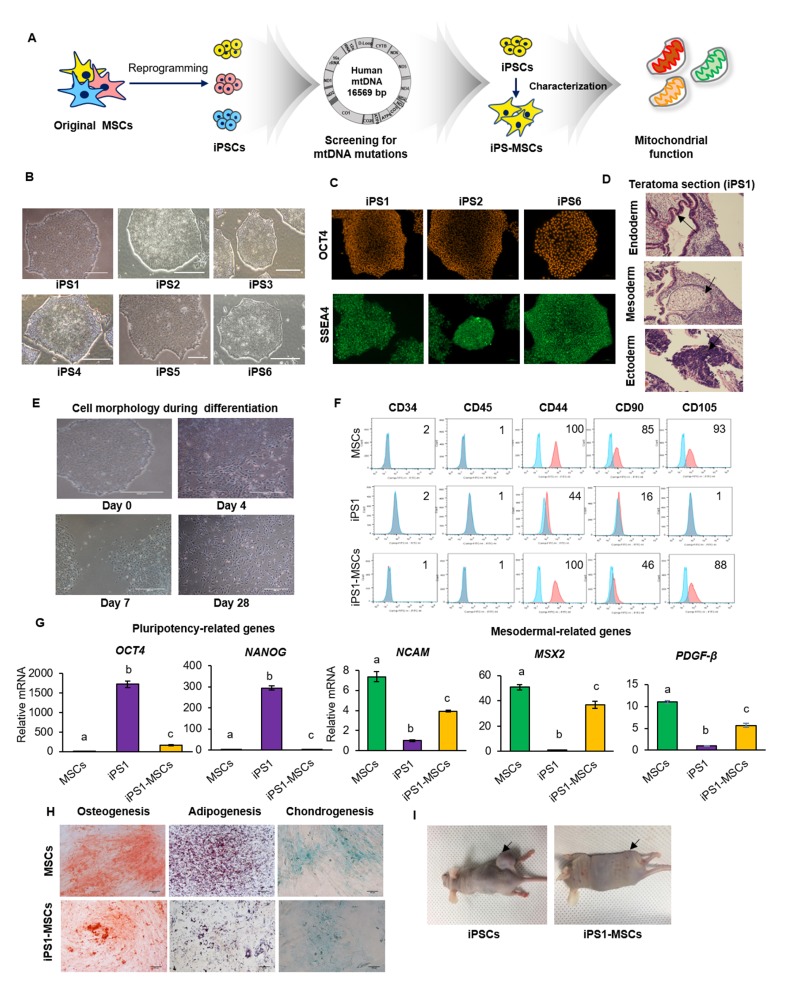
Fig. 1.
Characterization of iPS-MSCs and original MSCs. (A) Experimental design of the study. (B) Morphology of all iPSC lines similar to normal PSC morphology. (C) Characterizations of randomly selected iPSCs. OCT4 and SSEA4 were expressed in iPSC1, 2 and 6. (D) The teratoma formed in the mouse injected with iPSC1. Black arrows indicate three germ layers contained in teratoma. Scale bars = 500 μm. (E) Change in cell morphology to a spindle-like shape during differentiation of iPSC1 to MSCs. Scale bars = 500 μm. (F) Expression of CD markers in MSCs, iPSC1, and iPS1-MSCs. Both of MSCs and iPS1-MSCs were 100% positive in CD44. iPSC1 showed reduced expression of MSC positive markers. Negative MSCs markers, including CD34 and CD45, were expressed at less than 2% in all cell types. (G) Expression of pluripotency and mesodermal related genes in MSCs, iPSC1, and iPS1-MSCs. The level of the pluripotent gene OCT4 was higher in iPS1-MSCs than MSCs, while expression levels of the mesodermal genes NCAM, MSX2, and PDGF-β were lower in iPSC1 than MSCs. (H) Differentiation of MSCs and iPS1-MSCs into adipogenic, osteogenic, and chondrogenic lineages. (I) Teratoma formation by iPSC1 and iPS1-MSCs. No teratomas were observed in the mice injected with iPS1-MSCs. Black arrows indicate teratoma injection sites. The letters a, b, and c indicate significant (P < 0.05) differences among MSCs, iPSCs, and iPS-MSCs. Mean ± SEM. MSCs, mesenchymal stem cells; iPSCs, induced pluripotent stem cells; iPS-MSCs, iPSC-derived MSCs; NCAM, neural cell adhesion molecule; MSX2, Msh homeobox 2; PDGFβ, platelet-derived growth factor subunit B.

