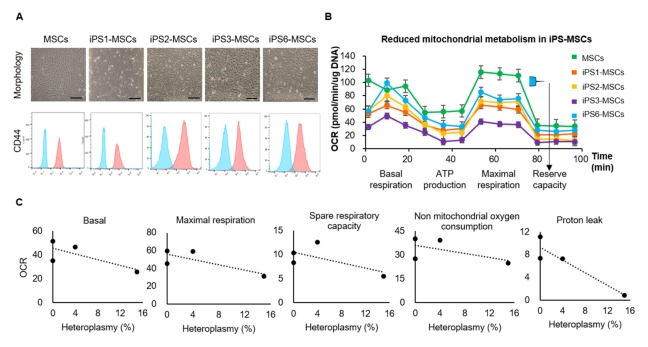
Fig. 3.
Mitochondrial respiration was lower in iPS-MSCs than in MSCs. (A) Cell morphology and expression of CD44 in iPS-MSC lines. iPS-MSC lines were similar to original MSCs morphologically and displayed positive CD44 expression. The results on expression of CD44 in MSCs and iPS1-MSCs was duplicated in Fig. 1F. Scale bars = 250 μm. (B) Lower OCR levels in iPS-MSC lines than in MSCs. Mean ± SM. (C) The correlation of lower OCR to higher heteroplasmy in non-synonymous or RNA gene mutations. Heteroplasmy percentages refer to the sum of heteroplasmy of non-synonymous and RNA gene mutations in each cell line. OCR, oxygen consumption rates.

