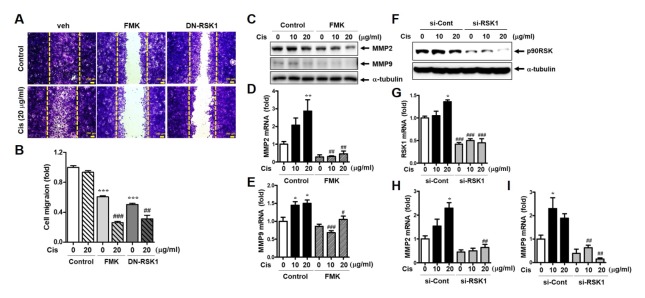
Fig. 2.
Effect of p90RSK activation on cell migration in Cis-DDP-induced MDA-MB-231 cells. (A) Cells were pretreated with 10 μM of FMK for 3 h or transfected with DN-RSK for 18 h followed by treatment with 20 μg/ml of Cis-DDP. After 36 h, cells were fixed, stained with crystal violet, and photographed using an Olympus microscope. The bar indicates 200 μm. (B) The migration area was measured using Image J software and indicated as fold change compared to the control (0) sample. (C–E) MDA-MB-231 cells were treated with the same conditions as above (Figure 2A) and whole protein lysates and RNA samples were subjected to western blotting (C) or qPCR (D, E) against MMP2 and MMP9. (F–I) MDA-MB-231 cells were transfected with siRNA from the control (si-Cont) or RSK1 (si-RSK1) for 48 h followed by treatment with 10 or 20 μg/ml of Cis-DDP for 24 h. (F) p90RSK protein expression was determined by western blotting. (G–I) Total RNA samples were subjected to qPCR against RSK1, MMP2, and MMP9 primers. The data are presented as means ± SEM (n = 3). *P < 0.05, **P < 0.01 or ***P < 0.001 compared with 0 sample; #P < 0.05, ##P < 0.01 or ###P < 0.001 compared with each control.

