Fig. 1.

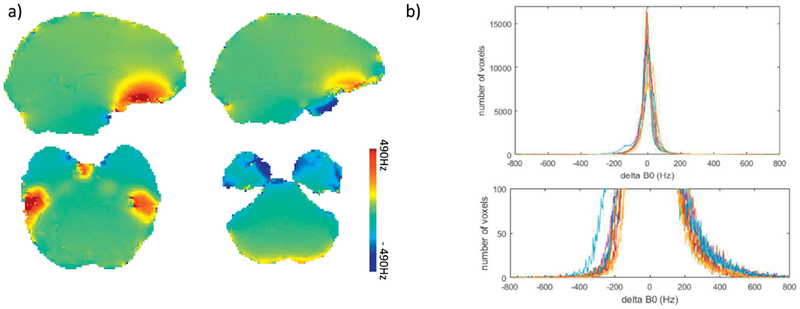
a) B0 map (in Hz) of brain areas with large ΔB0; b) the histogram of ΔB0for all recruited subjects (top), with the distribution of voxels with large ΔB0 zoomed in and displayed at the bottom.

a) B0 map (in Hz) of brain areas with large ΔB0; b) the histogram of ΔB0for all recruited subjects (top), with the distribution of voxels with large ΔB0 zoomed in and displayed at the bottom.