Fig. 6.

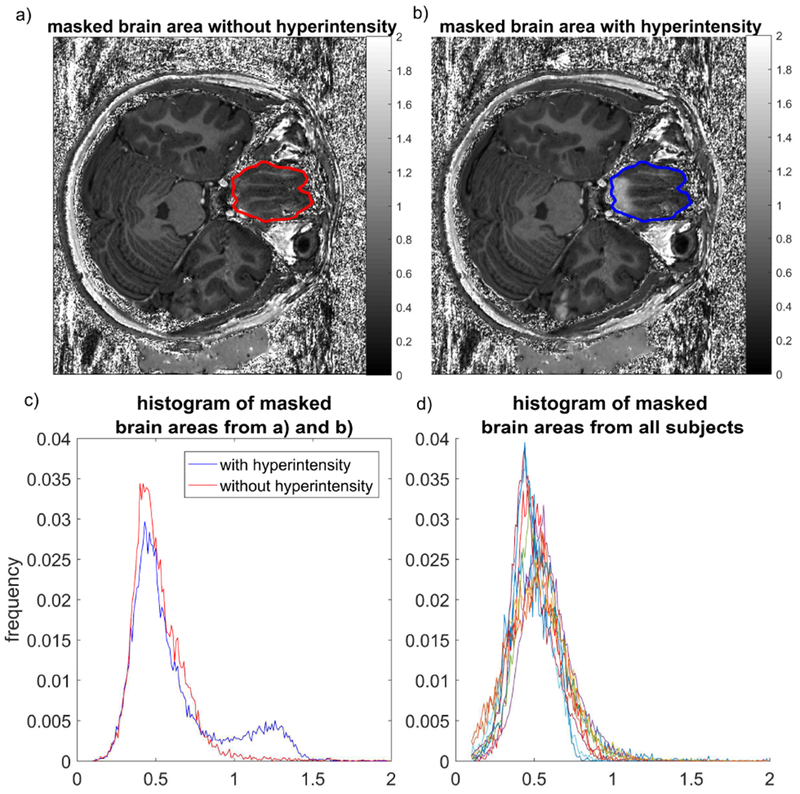
The histograms of T1w/PDw values from rectus gyrus area. An example of the ROI defined for generating the mask is shown on an image a) without and b) with hyperintensity. The masks from a) and b) are identical as the images are from the same subject. The corresponding histograms of pixel values are displayed in c) for the case with (blue) and without (red) hyperintensity. Histograms generated with the same method for all subjects with ΔtIR= 6144 us and ΔfIR = 300 Hz are displayed in d).
