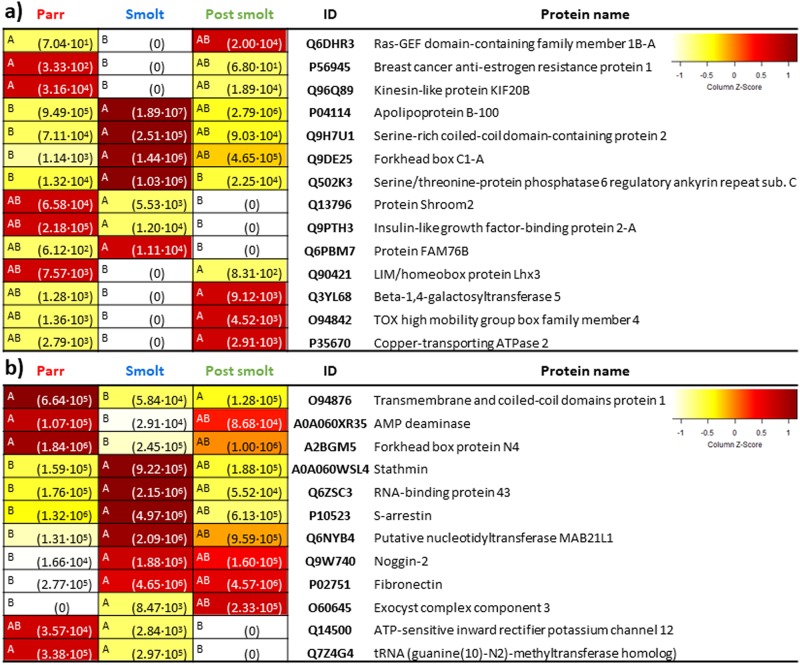
Fig 6. DAPs in whole (WP)(a) and enriched plasma (EP)(b).
Protein abundance heatmaps indicate significant differences (ANOVA, p < 0.05, on the left of each cell different letters indicate significant differences among three plasma pool replicates per developmental condition) and mean protein abundance (in brackets in each cell). “ID” indicates UniProt accession number of the proteins. On the top right, colour scale of the heatmaps (Z-Score representing normalized ion counts).

