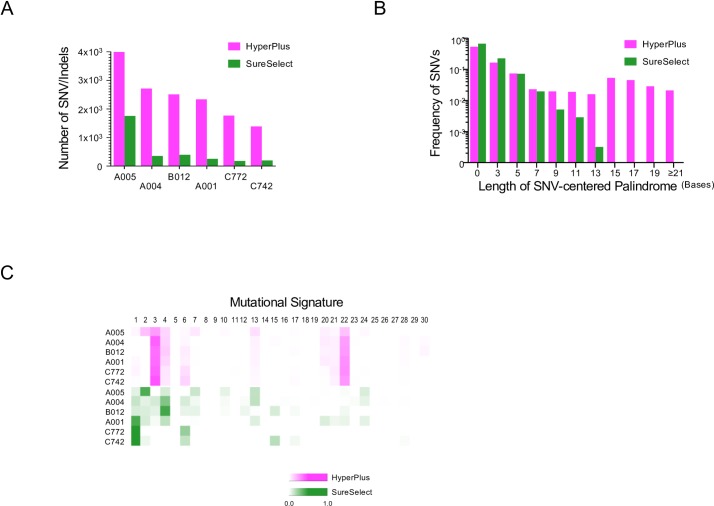
Fig 2. Differences in the sequenced results using the HyperPlus kit versus the SureSelect kit.
For each sample, the same DNA was sequenced with the two different kits: HyperPlus (magenta) and SureSelect (green) kits. (A) Number of SNVs/indels. Bar plots show the number of SNVs and indels. (B) Frequency of SNVs per length of palindrome. The frequency of SNVs from all samples (n = 6) is shown as bar plots per odd length of palindrome, in which a somatic SNV was detected at the center. The number on the x-axis indicates the total length of the palindrome. Note that a length “zero” indicates a sequence that lacks a palindrome. (C) Mutational signature heatmap. The heatmap represents the proportions of the 30 COSMIC mutational signatures [9] computed from trinucleotide frequencies of nucleotide substitutions in each sample. The number above the heatmap indicates each of the 30 signatures computed according to the definitions in the COSMIC database. Sample IDs are shown on the left.

