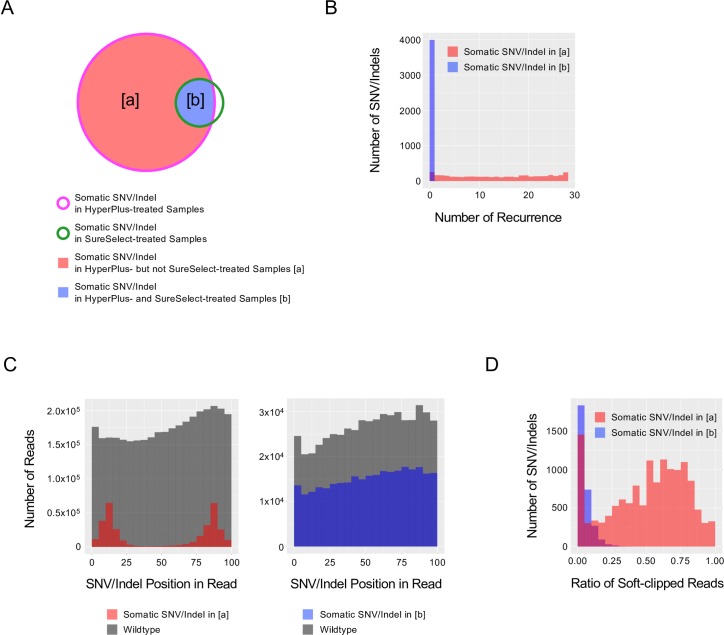
Fig 3. Features of SNV/indel noise caused by the HyperPlus kit.
(A) Venn diagram of somatic SNVs/indels detected in the HyperPlus- and SureSelect-treated samples. Magenta and green lines indicate HyperPlus and SureSelect treatments, respectively. The regions [a] (red) and [b] (blue) indicate somatic SNVs/indels detected in the HyperPlus-treated but not the SureSelect-treated samples (red), and those shared by both HyperPlus- and SureSelect-treated samples (blue), respectively. Note: features were extracted from BAM files from libraries prepared with the HyperPlus kit for tumor samples. (B) Histogram depicting recurrence in somatic SNV/indel detection across 28-sample libraries prepared with the HyperPlus kit. X- and y-axes indicate the number of recurrent detections of identical SNVs/indels and the number of SNV/indels, respectively. Red and blue colors indicate somatic SNVs/indels in [a] and [b] in (A), respectively. (C) Histogram for the distribution of SNV/indel position in the read. X- and y-axes indicate the positions of SNVs/indels within 5-bases and the number of reads, respectively. Left panel. Position of somatic SNVs/indels detected in [a] (red). Right panel. Positions of somatic SNVs/indels detected in [b] (blue). The number of wildtype nucleotide reads that mapped to the same genomic coordinate as the detected SNV/indel is indicated in grey. (D) Histogram for the ratio of the soft-clipped reads. X- and y-axes indicate the ratio of soft-clipped reads at 0.05 intervals and the number of SNV/indels, respectively.

