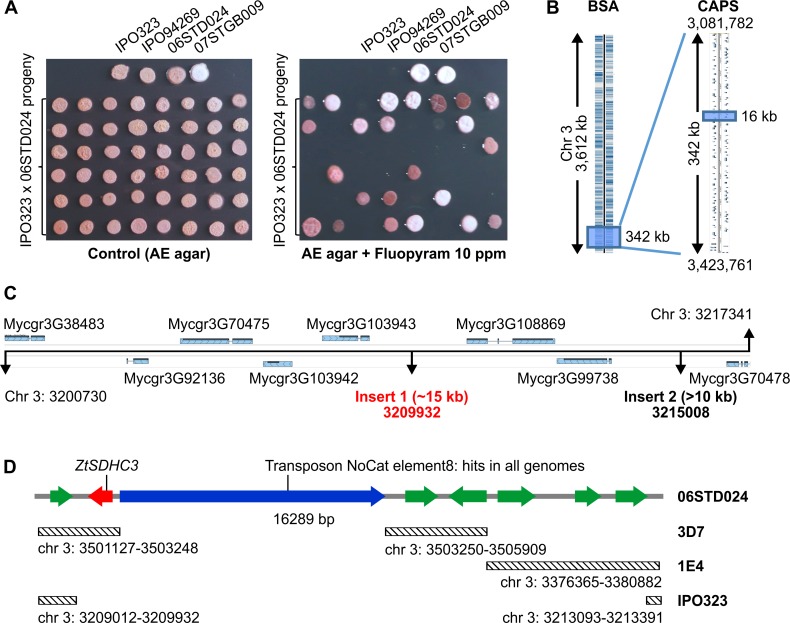
Fig 2. Fine mapping of fluopyram resistance factor using 06STD024 x IPO323 progeny.
(A) Agar plate growth assay used for characterizing progeny isolates for resistance or sensitivity to fluopyram. 2 μl of 2.106 cells.ml-1 were spotted onto AE agar supplemented or not with 10 mg.L-1 fluopyram and incubated at 20°C. Pictures were taken either 7 days (control) or 14 days (fluopyram) after inoculation. (B) IPO323 mapping intervals determined by BSA using 60 progeny isolates (i) and by CAPS markers (ii) on the full mapping population (234 progeny isolates). (C) 16 kb mapping interval of IPO323 chromosome 3. Structural variations at this locus between IPO323 and 06STD024 were determined using long range PCRs. Insert 1 was fully sequenced, only borders of insert 2 were sequenced. Insert 1 and insert 2 positions are based on the IPO323 genome. (D) Gene content of insert 1 region. Predicted genes and their orientation are visualized with arrows, green: putative genes, red: ZtSDHC3, blue: transposable element. Diagonally striped rectangles represent regions of high similarity (>90% identity) to other fully assembled Z. tritici genomes, corresponding chromosomal coordinates are indicated.

