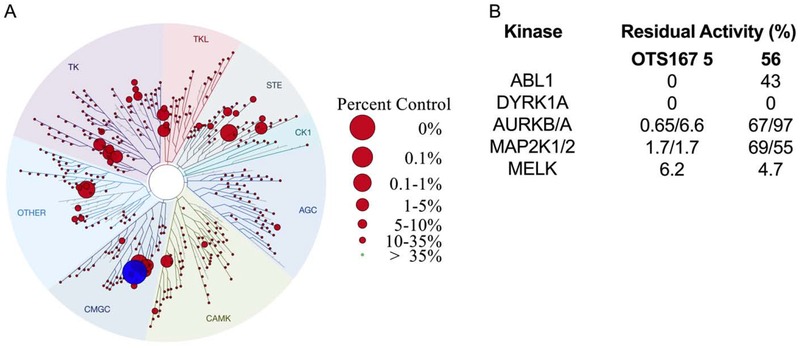
Figure 7.
Kinase selectivity profile for compound 56. (A) Kinome scan with compound 56 at 500 nM. DYRK1A is highlighted (blue). (B) Activity of select kinases (ABL1, DYRK1A, AURKB, AURKA, MAP2K1, MAP2K2, and MELK) with OTS 167 5 (100 nM) or compound 56 (500 nM) as a percent of the control (DMSO-treated) activity.

