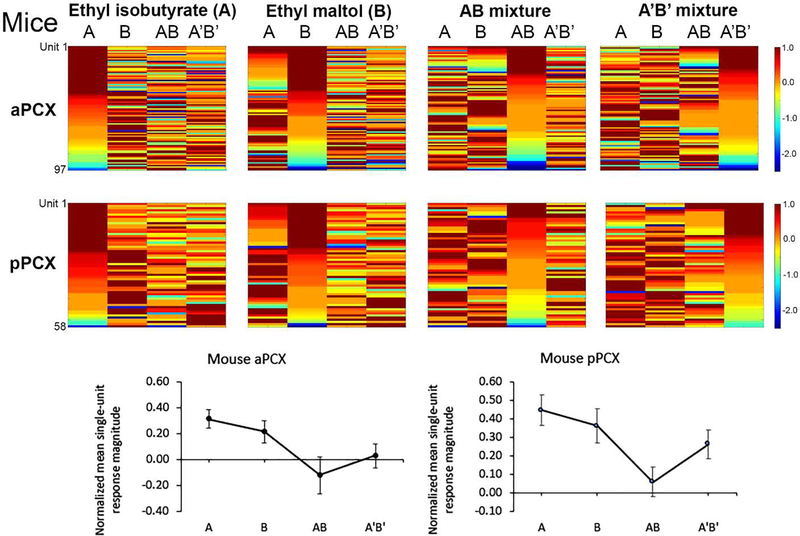
Figure 2.
(Top) Pseudocolor plots of mouse single-unit responses to two odor mixtures and their components. As in Fig. 1, each row is data from a single-unit color coded to reflect the normalized (maximal response = 1) to the four odors, sorted for cells showing their strongest response to odor A, odor B, AB or A’B’. As can be seen there are a subset of cells that are maximally responsive to each of the four different odors in both the aPCX and pPCX. (Bottom) Mean normalized response magnitude to each odor in the mouse aPCX and pPCX. Units in both regions showed significant mixture suppression compared to their response to the components (ANOVA, p < 0.05). Note that the configural AB mixture showed the strongest mixture suppression in both aPCX and pPCX.

