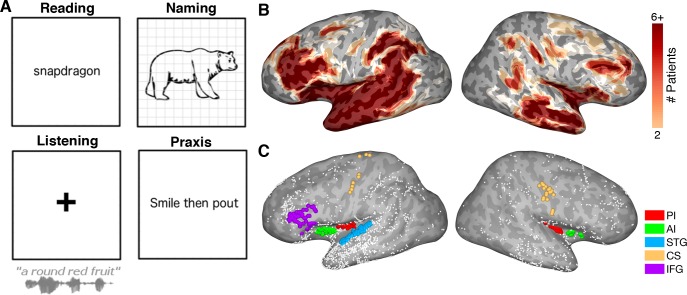
Figure 1. Experimental design.
(A) Schematic representation of the four tasks. (B) Representative spatial coverage map on a standard N27 inflated surface illustrating how many patients had electrodes in each brain region. (C) Individual electrodes shown on the same brain surface. Colored electrodes represent those included in each ROI for the grouped electrode analyses. PI: Posterior Insula, AI: Anterior Insula, STG: Superior Temporal Gyrus, CS: Central Sulcus, IFG: Inferior Frontal Gyrus.

