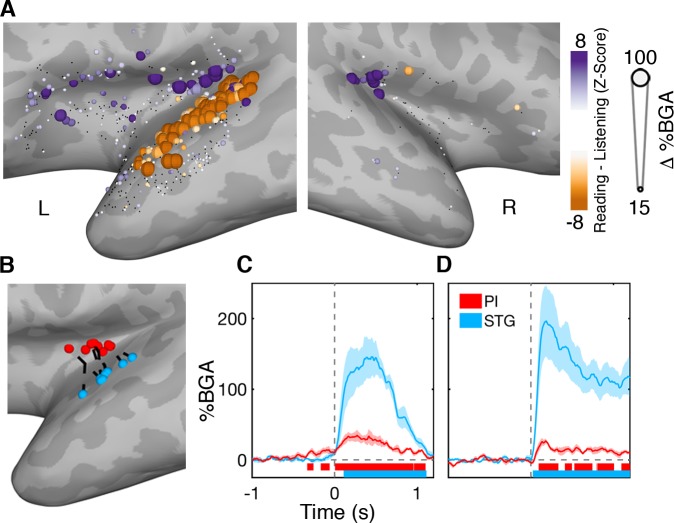
Figure 6. Functional dissociation of posterior insula from superior temporal gyrus.
(A) Contrast map comparing activation during self-generated speech in the reading task to external speech from the listening task in the 200 to 600 ms window. STG showed greater activation during speech perception while PI activity was greater during speech production. Electrodes with a non-significant difference (q > 0.05) shown in black. Electrode locations (B) and BGA for reading (C) and listening (D) for electrode pairs used for within patient comparisons of PI and STG activity. Colored bars under the BGA plots represents regions of significant activation (q < 0.05).

