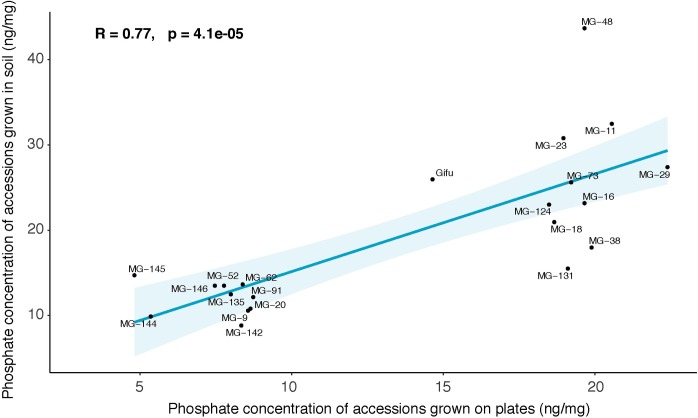
Fig 2. Correlation between phosphate concentration in plants grown on agar plates and in soil.
Each dot represents median concentration of phosphate in Lotus japonicus accessions. The value results from 4 biological replicates. In the top left corner, Pearson’s coefficient and p value are indicated. Colored lined and colored shades represent linear regression and 95% confidence intervals. Both agar plates and soil contained non limiting concentration of phosphate: agar plates contained 750 μM of phosphate and soil contained 200 mg/L of phosphate.

