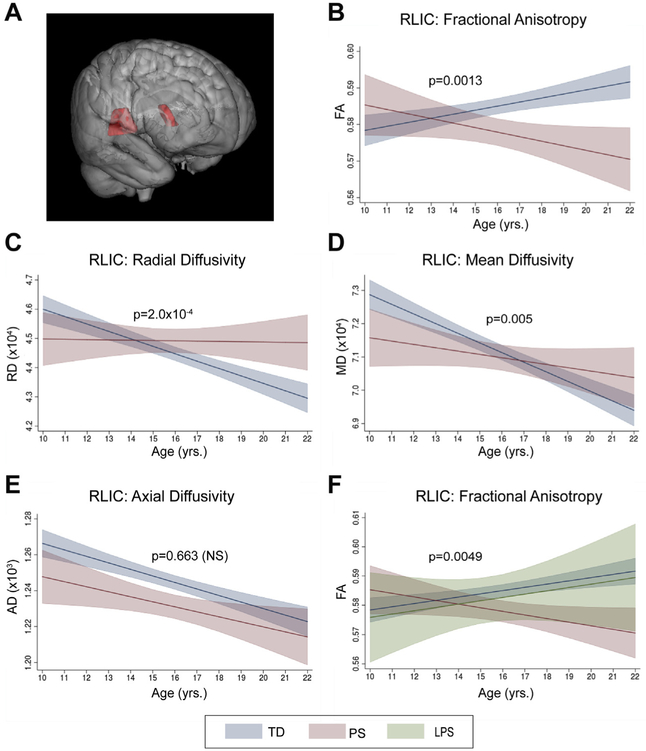
Figure 3.
Age-associated changes in the retrolenticular internal capsule (RLIC). (A) Three-dimensional representation of RLIC tract. In analyses of typically developing (TD) and psychosis spectrum (PS) groups, there was a significant interaction (p < .002) between age and group on RLIC fractional anisotropy (FA) (B). Follow-up analyses revealed significant age × group interactions (p < .025) on radial diffusivity (RD) (C) and mean diffusivity (MD) (D), but not on axial diffusivity (AD) (E). (F) Follow-up analyses including a third group, limited psychosis spectrum (LPS), also revealed a significant (p < .025) age × group interaction on RLIC FA. Graphs show predicted margins with 95% confidence intervals. Significance values represent corrected p values for age × group interactions. NS, not significant.

