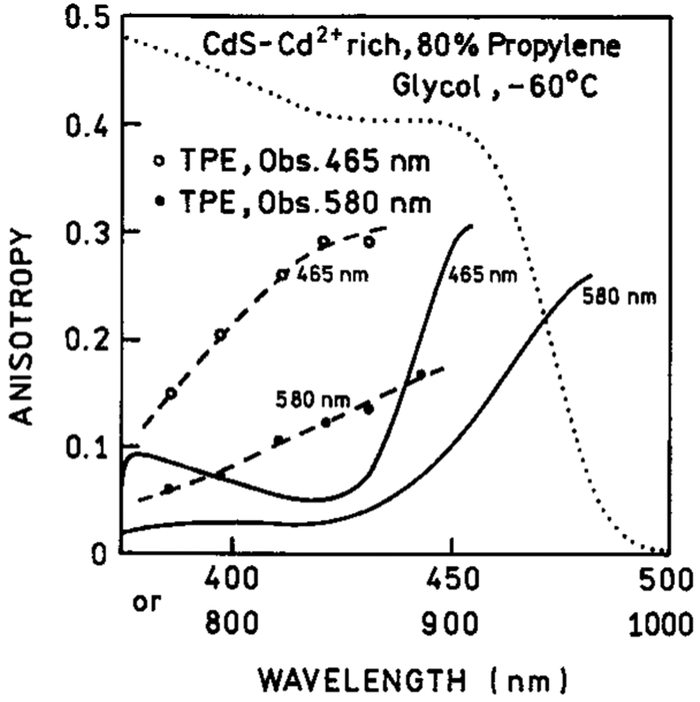
Figure 9.
Excitation anisotropies observed with two-photon induced emission of CdS–Cd2+ rich nanoparticles at two observation wavelengths −465 nm (- - ○ - -) and 580 nm (- - - ● - -). The solid lines are one-photon anisotropy spectra registered at 465 and 580 nm. The dotted line is an absorption spectrum.

