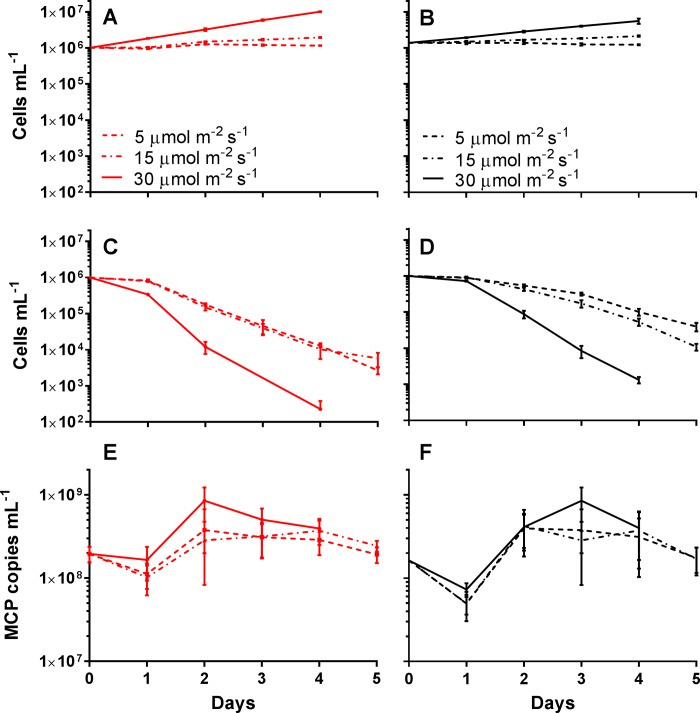
Fig 3. Aureococcus anophagefferens virus infection cycle dynamics with acclimation to varying light levels and in lower light.
A. anophagefferens host concentrations for uninfected cultures acclimated to A) 90 μmol photons m-2 s-1 and B) 30 μmol photons m-2 s-1, and infected cultures acclimated to C) 90 μmol photons m-2 s-1 and D) 30 μmol photons m-2 s-1 over the 5-day experiment. MCP copies mL-1 for cultures acclimated to E) 90 μmol photons m-2 s-1 and F) 30 μmol photons m-2 s-1 over the 5-day experiment. Cultures were infected on day 0. Solid lines indicate acclimated cultures maintained at acclimated irradiance levels after infection, dotted and dashed lines indicate acclimated cultures transferred into 15 μmol photons m-2 s-1 light after infection, and dashed lines indicate acclimated cultures transferred into 5 μmol photons m-2 s-1 light after infection. All symbols are for n = 5 five biological replicates ± SD.

