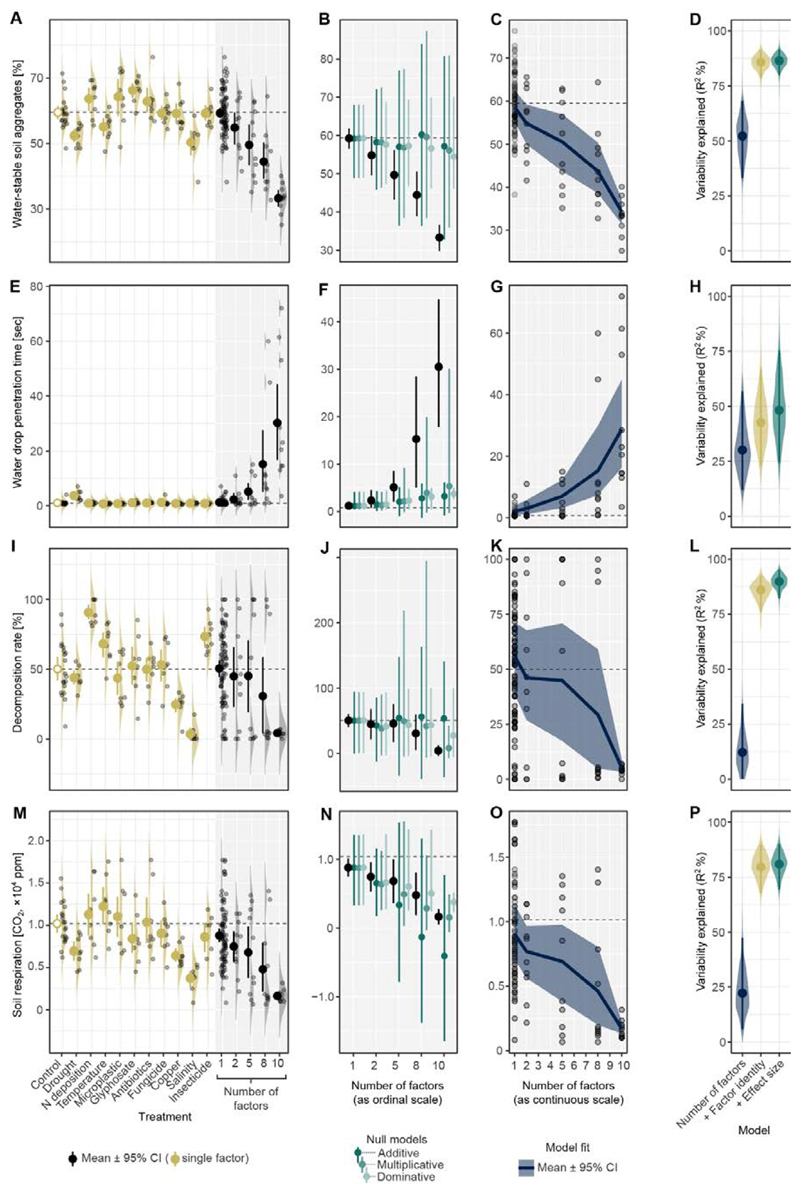
Fig. 3. Effects on soil properties of global change factors applied singly and using different numbers of factors (2, 5, 8, 10 factors).
For each measured soil property (each row), single factor effects were estimated (1st column) and then used to predict multi-factor effects based on three different assumptions on how to combine multiple effect sizes (2nd column). An ideal prediction should have a small bias (accuracy) and narrow confidence interval (precision), but for the 1st and 2nd rows, predictions were neither accurate nor precise, regardless of the assumption used. The predictions are made difficult because the single factor effects have large variability and/or because there are strong factor interactions. The direction of the treatment effects were consistent with an increasing number of factors for all properties (3rd column). These curves were estimated using a random forest machine learning, and their predictability is shown in the 4th column (dark blue). Predictability was improved by adding factor identity information (0/1 for each factor; dark yellow) or effect size information (predicted values based on three assumptions; dark green) to the models as predictors (4th column), but predictability did not always improve (see H). Water stable soil aggregates (A-D); soil water repellency measured as water drop penetration time (E-H); decomposition rate (I-L); and, soil respiration (M-P). Replicates are represented by dots with density ridgeline plots. Horizontal dashed lines represent mean values of the control.

