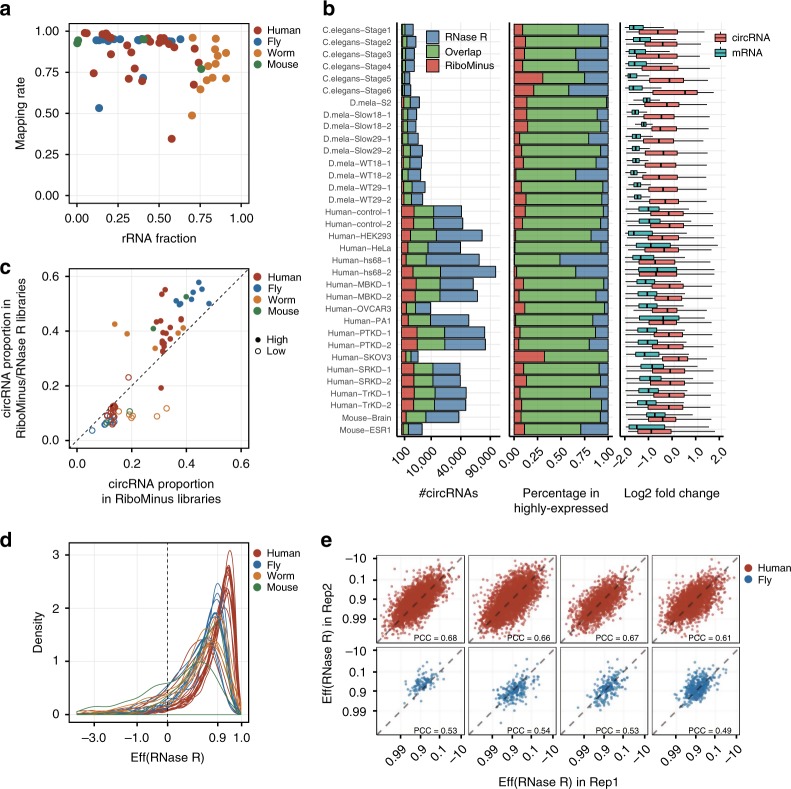
Fig. 1. Challenges in quantifying the expression of circular RNAs.
a The fraction of ribosomal RNA reads in 63 RNA-seq datasets from four different species. x- and y-axis represent the fraction of reads mapped to rRNA sequences and the reference genome in all sequencing reads, respectively. b RNase R treatment affects circRNA numbers and their expression levels. Left: total number of detected circRNAs in RiboMinus and RiboMinus/RNase R-treated samples. Middle: percentage of highly expressed circRNAs detected in both RiboMinus and RiboMinus/RNase R samples. Right: Boxplot shows the change of circRNA and mRNA expression levels after RNase R treatment. Expression levels of circRNAs were measured as the number of BSJ reads of each circRNA divided by the total number of BSJ reads. Gene expression levels were measured by TPM (transcript per million). c Proportion of highly (top 50%) and lowly (bottom 50%) expressed circRNAs reads in RiboMinus and RiboMinus/RNase R data. RNase R treatment tends to enrich highly expressed circRNAs but reduce lowly expressed circRNAs. d Density distribution of RNase R enrichment coefficient for circRNAs in four species. The vertical dashed line at x = 0 indicates a null enrichment effect of circRNAs. e Replication of RNase R enrichment coefficient in two experimental replicates of eight RNA-seq datasets. X- and y-axis represent the log transformed (1−x) of RNase R treatment coefficient.

