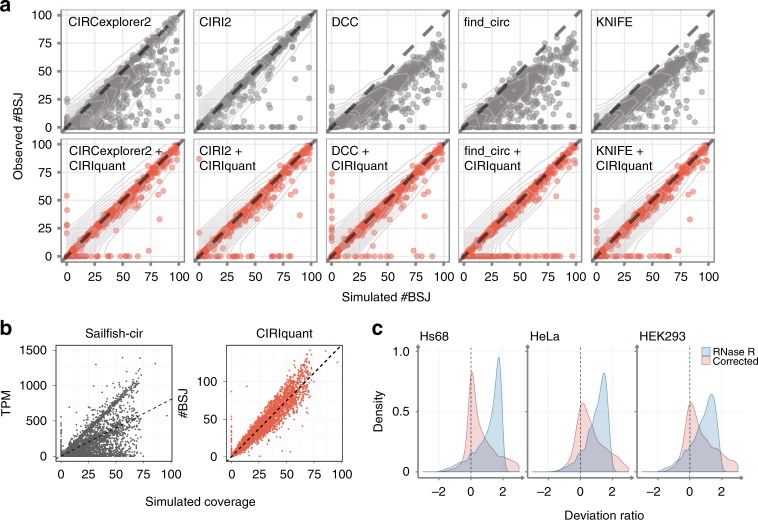
Fig. 3. Performance of CIRIquant on simulated data.
a The correlation between simulated and estimated number of BSJ reads. CIRIquant was performed with predicted circRNA junction sites using five different algorithms. The correlation before and after CIRIquant correction are shown separately. Obviously, for all these tools, the inclusion of CIRIquant can significantly improve circRNA quantification and remove false-positive predictions. b Comparison of Sailfish-cir and CIRIquant on the simulated dataset. TPM of identified circRNAs was used to evaluate the performance of Sailfish-cir. x-axis represents the simulated coverage of each circRNA, and the fitted linear-regression model was plotted as the dashed line. c Density distribution of deviation ratio of circRNA expression levels between RiboMinus and RiboMinus/RNase R samples. The distribution of deviation ratio derived from uncorrected BSJ reads and expression values after CIRIquant correction are shown in blue and red, respectively. After the correction of RNase R treatment efficiency by CIRIquant, there is no much difference on circRNA quantification between RiboMinus and RiboMinus/RNase R samples.

