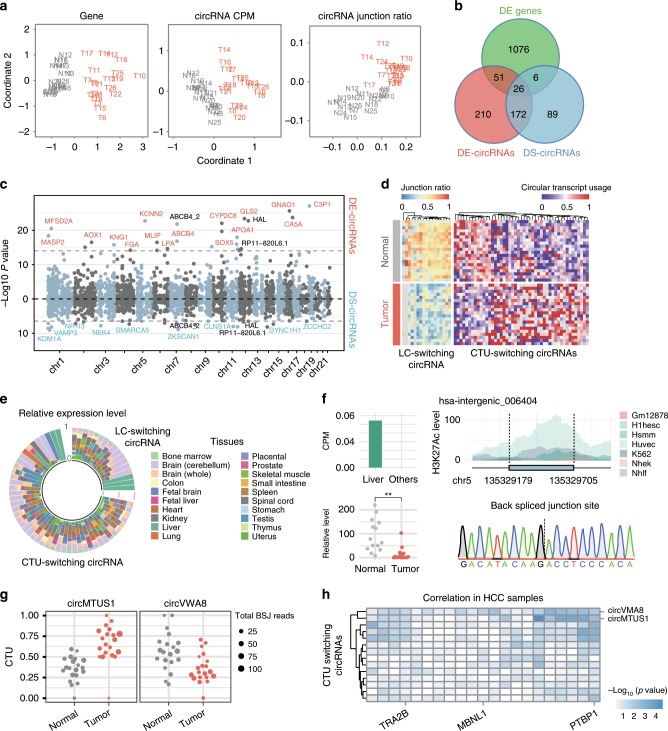
Fig. 6. Differentially expressed circRNAs in hepatocellular carcinoma.
a Multi-dimensional analysis using gene expression level, circRNA expression values and junction ratios. Distances between samples are calculated based on log2 fold change. Tumor and normal samples are shown in red and gray, respectively. b Overlap of significantly changed genes and host genes of DE-circRNAs and DS-circRNAs. c Manhattan plot of p-values from DE- and DS-circRNAs. Horizontal dashed lines indicate top 25 most significant DE- and DS-circRNAs. DE-specific and DS-specific circRNAs are shown in red and blue, respectively. CircRNAs that are shared by DE and DS groups are shown in black. d Hierarchical clustering of linear-circular (LC) switching and circular transcript usage (CTU) switching circRNAs. The junction ratio and CTU of these circRNA in 20 pairs of HCC samples were plotted, respectively. e Tissue specific expression level of LC-switching and CTU-switching circRNAs. The relative expression level represents the proportion of expression value in specific tissue compared to all 20 tissues. f An instance of LC-switching circRNAs, hsa-intergenic_006404. The bar plot indicates the liver-specific expression pattern of this circRNA. The beeswarm plot shows its expression level in 14 pairs of tumor and normal tissues measured by qPCR. The H3K27Ac marks of upstream and downstream 300 nt region are plotted, indicating the potential biogenesis mechanism of hsa-intergenic_006404 from intergenic region. g Top two CTU-switching circRNAs that are correlated with the most RBPs. h The correlation between RBP expression level and CTU of CTU-switching circRNAs. The color gradient in the heatmap represents the −log10 p value from spearman correlation test.

