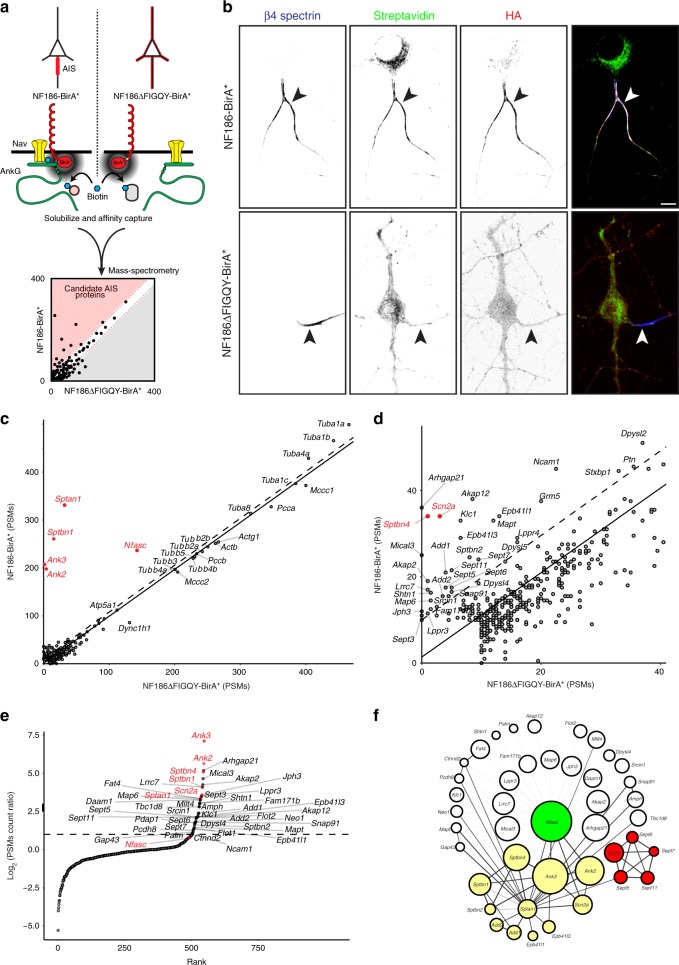
Fig. 1. Proximity biotinylation using NF186-BirA* reveals AIS-associated proteins.
a The experimental strategy using BirA*-dependent proximity biotinylation to identify AIS proteins. b Immunolabeling of DIV14 hippocampal neurons transduced at DIV11 using adenovirus to express HA-tagged NF186-BirA* and NF186∆FIGQY-BirA*. From DIV13, neuronal culture media included 50 μM biotin. AIS (arrowheads) are labeled using antibodies against β4 spectrin (blue). The NF186-BirA* and NF186∆FIGQY-BirA* chimeras are labeled using anti-HA antibodies (red). Biotinylated proteins were detected using Alexa488-conjugated Streptavidin. Scale bar = 5 μm. c, d The number of peptide spectral matches (PSMs) for each biotinylated protein identified by mass spectrometry and shown at different scales. Known AIS and NF186-interacting proteins are indicated in red. The solid line is the least-squares fit of the biotinylated proteins while the dotted lines parallel to the least-squares fit line represent an arbitrary minimum of ten PSMs confidence interval. PSMs are the average PSM counts for two independent replicates for each chimera. e Rank plot showing the enrichment of NF186-BirA* PSMs over NF186∆FIGQY-BirA* PSMs. f Protein interaction network generated using Cytoscape and the STRING database of protein interactions. With the exception of Nfasc, the size of each circle is proportional to the ratio of the PSMs count for each protein indicated. White circles include proteins with no previously reported function at the AIS. Yellow circles correspond to the ankyrin/spectrin network, and red circles correspond to the septin network.

