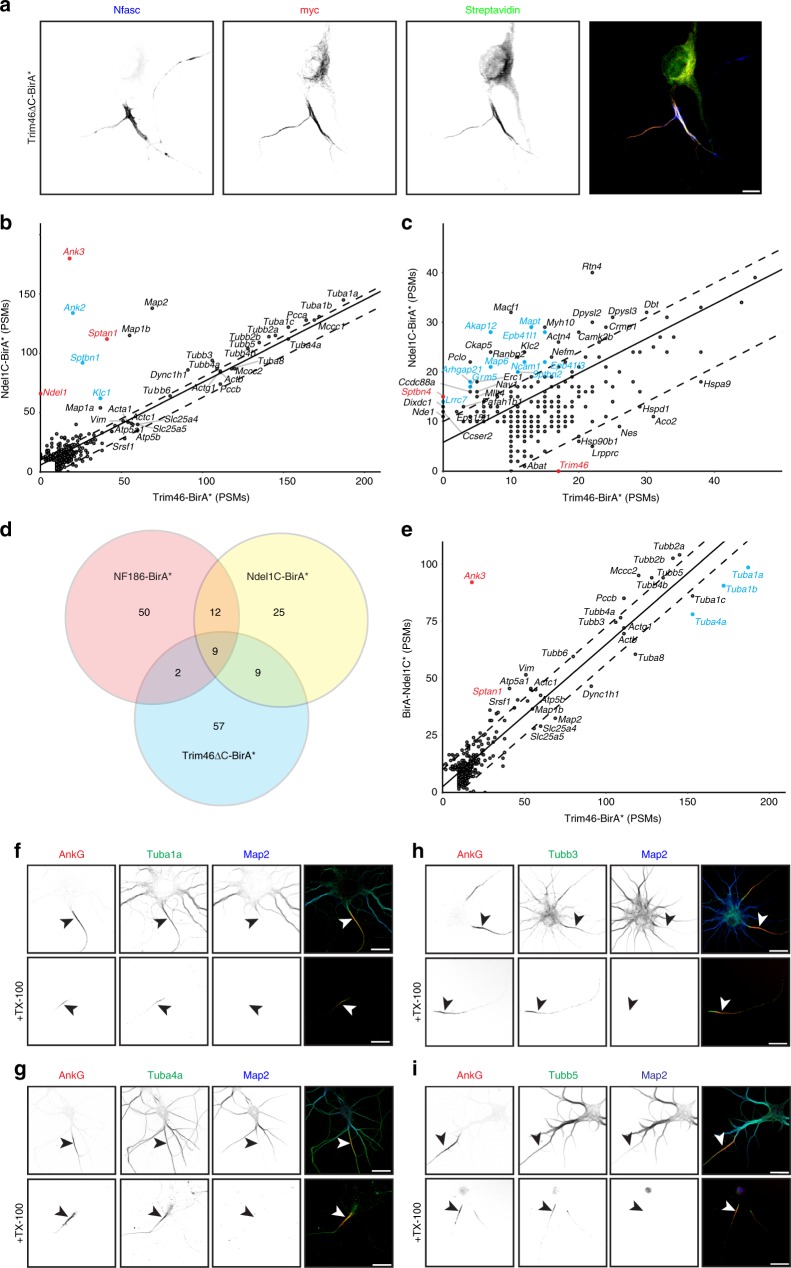
Fig. 8. The Trim46 proximity proteome reveals AIS tubulins.
a Immunolabeling of DIV14 hippocampal neurons transduced at DIV11 using adenovirus to express myc-tagged Trim46∆C-BirA*. From DIV13, neuronal culture media included 50 µM biotin. AIS are labeled using antibodies against Neurofascin (Nfasc, blue). The Trim46∆C-BirA* chimera is labeled using anti-myc antibodies (red). Biotinylated proteins were detected using Alexa488-conjugated Streptavidin. Scale bar = 5 µm. b, c Comparison of the peptide spectral matches (PSMs) for each protein biotinylated by Ndel1C-BirA* and proteins identified using combined Trim46∆C-BirA* and BirA*-Trim46∆C chimeras (referred to as Trim46-BirA*); panels b and c are shown at different scales. Known AIS proteins are indicated in red. Proteins enriched and previously identified as candidate AIS proteins in the NF186-BirA* samples are indicated in blue. The solid line is the least-squares fit of the biotinylated proteins while the dotted lines parallel to the least-squares fit line represent an arbitrary minimum of ten PSMs confidence interval. d Venn-diagram illustrating the number of candidate AIS proteins identified in each proximity proteome. e Comparison of the PSMs for each protein biotinylated by BirA*-Ndel1C and proteins identified using combined Trim46∆C-BirA* and BirA*-Trim46∆C chimeras. Known AIS proteins are indicated in red. Proteins enriched and previously identified as candidate AIS proteins in the NF186-BirA* samples are indicated in blue. The solid line is the least-squares fit of the biotinylated proteins while the dotted lines parallel to the least-squares fit line represent an arbitrary minimum of ten PSMs confidence interval. f–i Immunostaining of DIV14 cultured hippocampal neurons using antibodies against AnkG (red), Tuba1a (f, green), Tuba4a (g, green), Tubb3 (h, green), Tubb5 (i, green), and Map2 (blue). The lower panels show the Triton X-100 detergent-resistant pools of the indicated tubulins. AIS are indicated by arrowheads. Scalebars = 10 µm.

