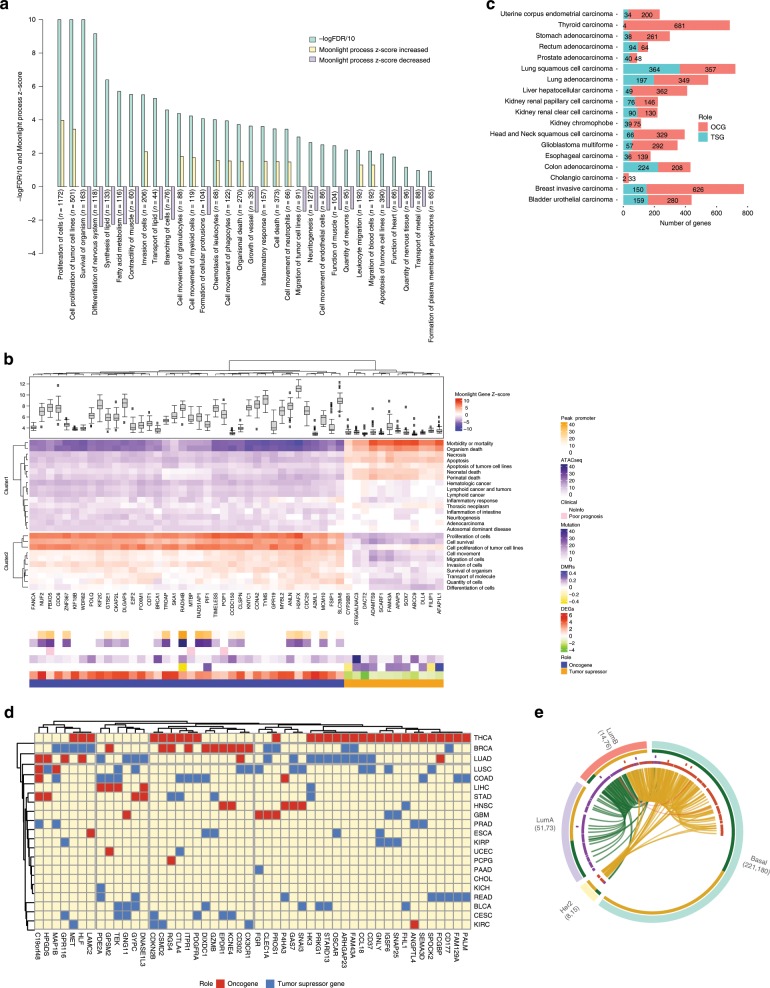
Fig. 2. Moonlight application within breast-cancer case study.
a Barplot from Functional Enrichment Analysis showing the BPs enriched significantly with |Moonlight Process Z-score| > = 1 and FDR < = 0.01; increased levels are reported in yellow, decreased in purple, and green shows the -logFDR/10. A negative Moonlight Process Z-score indicates that the process’ activity is decreased, while a positive Moonlight Process Z-score indicates that the process’ activity is increased. Values in parentheses indicate the number of genes in common between the genes annotated in the biological process and the genes used as input for the functional enrichment. b Heatmap showing the top 50 predicted tumor suppressors and oncogenes in breast cancer and their associated biological processes. Hierarchical clustering was performed on the Euclidean distance matrix. Biological Processes with increased (decreased) Moonlight Gene Z-score are marked in red (blue). The number of samples reporting the mutation of specific genes ranges from white to dark purple. Hypermethylated (hypomethylated) DMR are shown in blue (yellow). Genes with poor Kaplan–Meier survival prognosis are marked in pink. Chromatin accessibility in the promoter region ranges from white (closed) to orange (open). The upper panel shows boxplots of cell-line expression levels. c Barplot reporting the number of tumor-suppressor genes (blue) or oncogene (red) predicted in pan-cancer analysis using expert knowledge paired with PRA using two selected biological processes, such as apoptosis and cell proliferation. d Heatmap showing the top 50 dual-role genes (by Moonlight Gene Z-score) within cancer types, oncogenes (OCGs) are shown in red and Tumor-Suppressor Genes (TSGs) in blue. TCGA study abbreviations available at https://gdc.cancer.gov/resources-tcga-users/tcga-code-tables/tcga-study-abbreviations. e Circos plots for molecular subtypes of Moonlight genes predicted using expert knowledge paired with PRA using two selected BPs, such as apoptosis and cell proliferation. From outer to the inner layer, the color labels are breast-cancer subtype. In the parentheses, the number of OCGs and TSG for a specific molecular subtype; OCGs (green) and TSGs (yellow); purple and orange for mutations: inframe deletion, inframe insertion, missense; gene–gene edges between two cancer molecular subtypes are OCG in both (green), TSG in both (yellow), dual-role genes (red).

