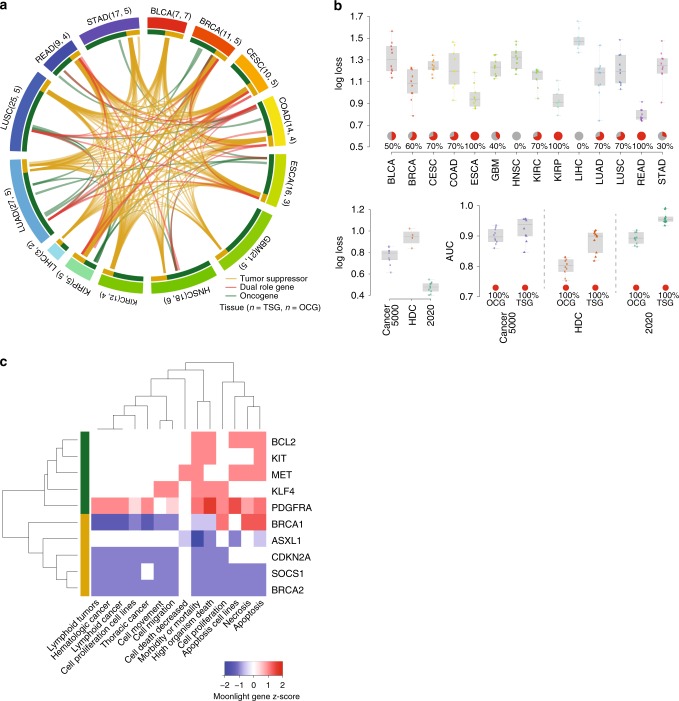
Fig. 6. Moonlight a Pan-Cancer study: dual-role genes and machine-learning approach.
a Circos plot showing an integrative analysis of 14 TCGA cancer types using the ML approach. Labels around the plot specify the cancer type; the number of OCGs and TSGs for that cancer type are in parentheses. An edge is drawn in the center of the figure whenever the same gene is predicted in two different cancer types. Segments and edge colors correspond to cancer type: green (yellow) segments correspond to the number of OCGs (TSGs) predicted in that cancer type, and red edges represent dual-role genes. b Performance evaluation of Moonlight in terms of log loss for tumor suppressors and oncogenes predicted in 14 cancer types. Performance of 20/20 + and OncodriveRole in terms of log loss and AUC. c Heatmap showing Moonlight Gene Z-score for upstream regulators for rectum adenocarcinomas. Row colors indicate TSGs (yellow) and OCGs (green).

