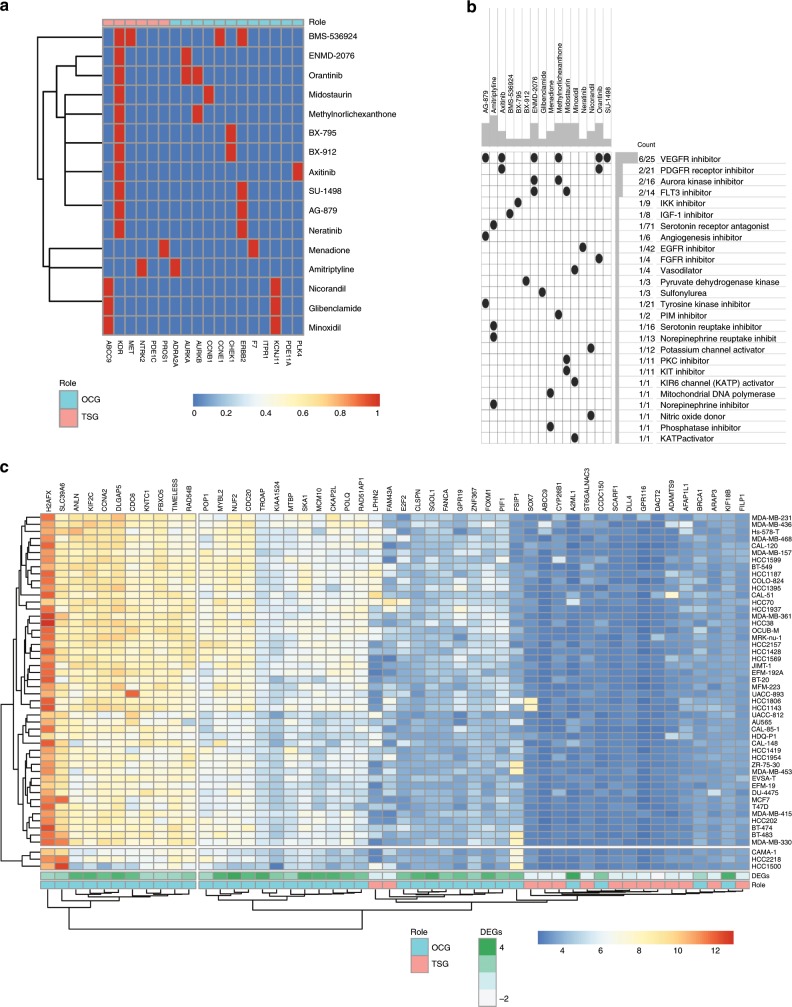
Fig. 7. Moonlight intratumor heterogeneity, cell line, and drug analysis.
a Heatmap showing each compound (perturbagen) in rows from the Connectivity Map that share gene targets predicted as OCG (salmon) or TSG (teal) in columns. A red square indicates the presence of a relationship between compound and target. b Heatmap showing each compound (perturbagen) in columns from the Connectivity Map that shares mechanisms of action (rows), sorted by descending number of compounds with shared mechanisms of action. c Heatmap showing the top 50 TSG and OCG (by Moonlight Gene Z-score) predicted in breast cancer as mediators of apoptosis and proliferation (columns) and expression profiles of 50 breast-cancer cell lines from the Genomics of Drug Sensitivity in Cancer (GDSC) database (rows).

