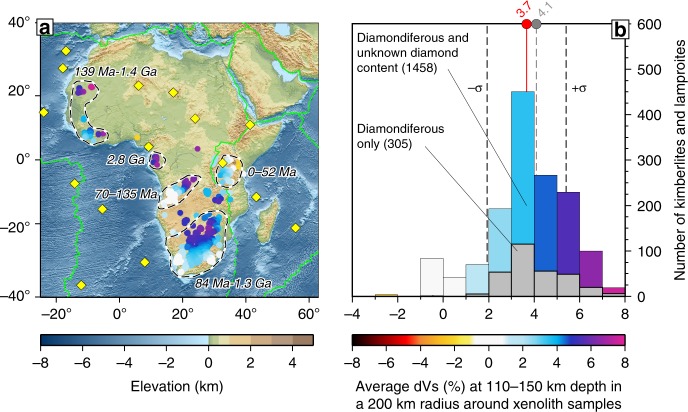
Fig. 3. Seismic velocity in the lithosphere beneath kimberlites and lamproites.
The emplacement age ranges from65 are indicated on the map for the different areas (dashed lines). Values of the average over the 110–150 km depth range and within a 200-km-radius circle around each Kimberlite sample are plotted on the map (a) and as a histogram (b). colour scale is as in Fig. 1c. The circle sizes show the lateral averaging area. Average across all diamondiferous and unknown-diamond-content kimberlites and lamproites is shown with a red line and dot (b), with the standard deviation also shown. Average for diamondiferous samples only is shown with a grey line and dot. Both groups present the same pattern: most are not on thick cratonic lithosphere at present. Elevation and bathymetry are plotted on panel a; plate boundaries are plotted in green.

