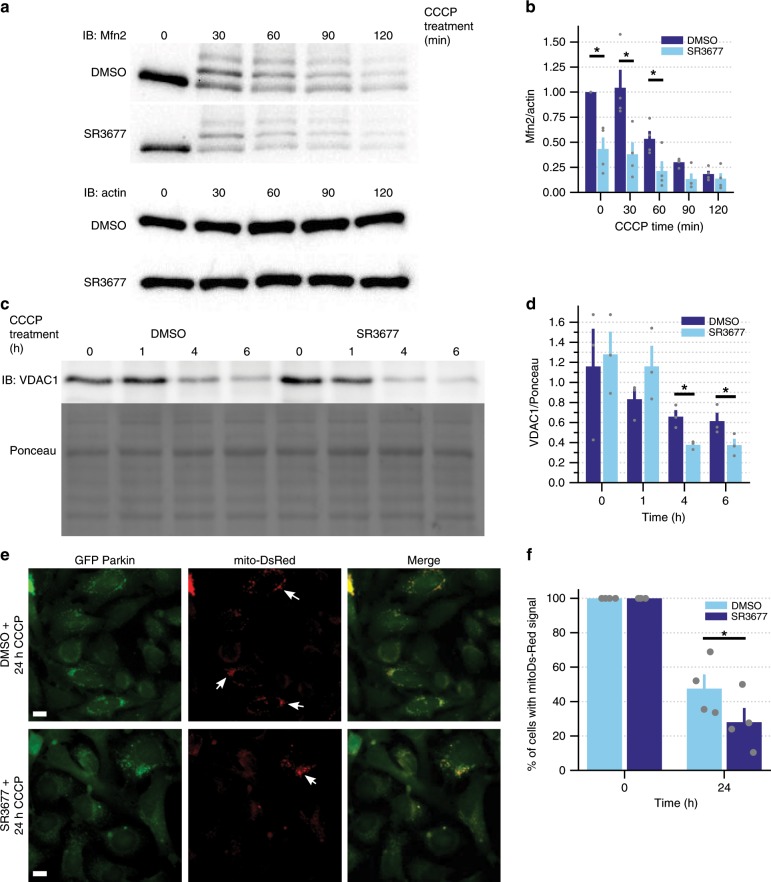
Fig. 2. SR3677 reduces mitochondrial mass upon induction of mitochondrial damage.
HEK293 GFP Parkin cells treated with 0.5 µM SR3677 or DMSO for 2 h were incubated with 10 µM CCCP for the indicated time in minutes or hours. Cell lysates were harvested, proteins were separated by SDS-PAGE and immunoblotting was performed with a anti-Mfn2, anti-actin and c anti-VDAC1 antibodies. Ponceau staining was performed prior to immunoblotting as a loading control. b, d Densitometry analysis was performed to quantify Mfn2 (a) and VDAC1 (c) levels in each sample, followed by normalization to actin loading control (a) (n = 4 independent experiments), or Ponceau staining (c) (n = 3 independent experiments). Data are expressed as mean ± s.e.m. P-values were determined by paired one-tailed Student’s t-test, *P < 0.05. e HeLa cells stably expressing mito-DsRed and GFP Parkin were pre-treated with either DMSO or 0.5 µM SR3677, followed by 24-h treatment with 10 µM CCCP or DMSO. Scale bars, 10 µm. f Quantification of the percentage of cells that retained mitochondrial (mito-DsRed) signal. Cells with positive mitochondrial signal are indicated by arrows in e. Data are expressed as mean ± s.e.m (n = 4 independent experiments). P-values were determined by paired one-tailed Student’s t-test, *P < 0.05. Error bars represent s.e.m.

