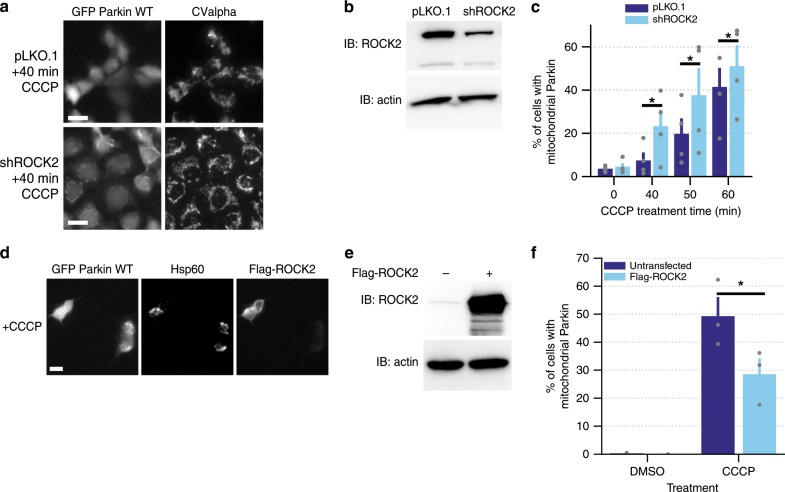
Fig. 4. Genetic manipulation of ROCK2 levels mimics effect of SR3677-mediated ROCK2 inhibition.
a HEK293 GFP Parkin cells stably expressing either pLKO.1 empty control vector or shRNA against ROCK2 (shROCK2) were treated with 10 µM CCCP for 40 min. Immunostaining was performed with anti-CValpha antibody. Scale bars, 10 µm. b Cells stably expressing either pLKO.1 empty vector or shRNA against ROCK2 were harvested and proteins were separated by SDS-PAGE. Immunoblotting was performed with anti-ROCK2 and anti-actin antibody. c Quantification of the percentage of cells with mitochondrial Parkin following treatment with 10 µM CCCP (n = 3 independent experiments). d HEK293 GFP Parkin cells were transfected with Flag-ROCK2; 24 h following transfection, cells were treated with 10 µM CCCP. Immunostaining was performed with anti-Flag and anti-Hsp60 antibodies. Scale bars, 10 µm. e Untransfected cells and cells transfected with Flag-ROCK2 were harvested and proteins were separated by SDS-PAGE. Immunoblotting was performed using anti-ROCK2 and anti-actin antibodies. f Quantification of the percentage of untransfected and Flag-ROCK2 transfected cells with mitochondrial Parkin distribution (n = 3 independent experiments). P-values were determined by one-tailed paired Student’s t-test, *P < 0.05. All graph data are expressed as mean ± s.e.m. All error bars represent s.e.m.

