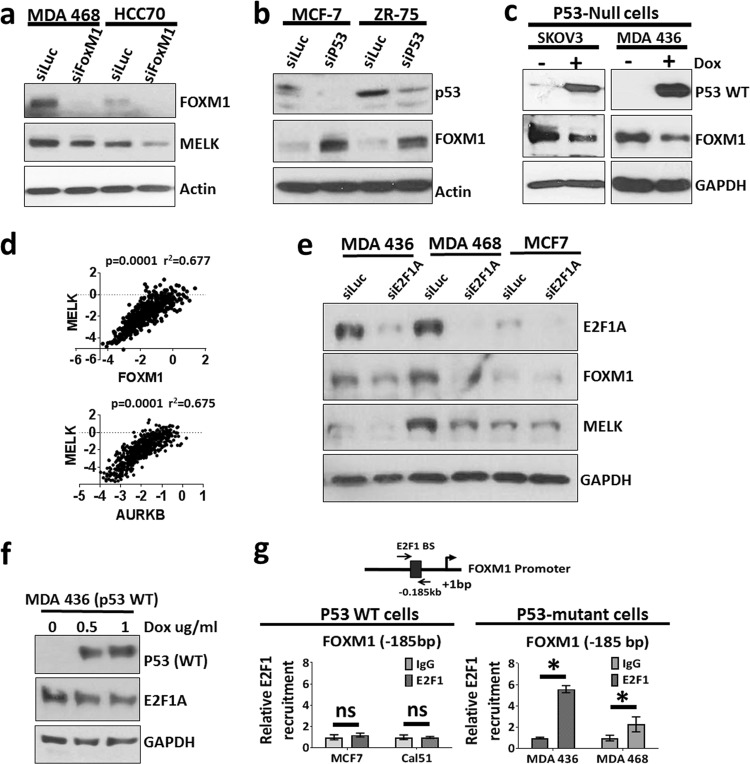
Fig. 5. Wild-type p53 represses MELK expression by regulating FOXM1.
a Western blotting analysis of MELK and FOXM1 protein levels in TNBC cells (MDA 468 and HCC70) after knocking down FOXM1. b Western blotting analysis of FOXM1 protein levels after wild-type p53 knockdown in MCF7 and ZR-75 cells. c Western blotting analysis of MELK and p53 protein levels in p53-null cells, SKOV3 (left) and MDA MB 436 (right) after inducing wild-type p53 for 48 h. Wild-type p53 was induced, using a doxycycline-inducible system, in p53-null cells. d Correlation analysis of MELK mRNA levels with FOXM1 and AURKB (FOXM1 downstream gene) in TCGA breast cancer dataset. The scale for the expression of MELK, FOXM1, and AURKB is log2-median-centered ratio. The Pearson’s correlation p-values and r2-values were calculated using GraphPad prism. e Western blotting analysis of MELK, FOXM1, and E2F1 protein levels in p53-mutant cells (MDA 436 and MDA 468) and wild-type p53 cells (MCF7) after E2F1 knocking down. f Western blotting analysis of E2F1 in MDA 436 cells after inducing wild-type p53 expression using doxycycline (Dox)-inducible system. g E2F1 ChIP assay to determine the relative recruitment of E2F1 to FOXM1 promoter in p53 WT cells (MCF7 and Cal51) and p53 mutant cells (MDA MB 436 and MDA MB 468). Triplicates of ChIP samples were subjected to qPCR assay using primers against FOXM1 promoter (see Supplementary Table 5 for primers). The qPCR data were normalized to % input and then relative recruitment of E2F1 was calculated as a fold change over IgG. *Statistical significance of p-value < 0.05. Error bars represent ± SD.

