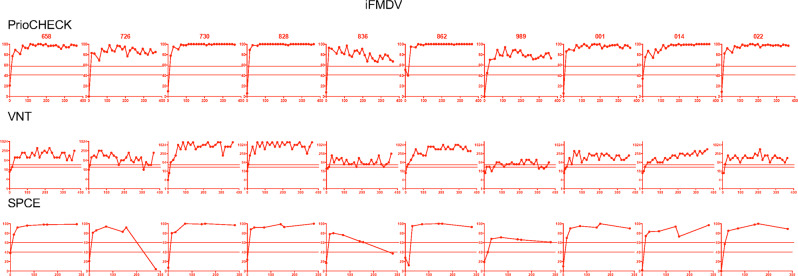
Fig. 2. Humoral responses induced by the iFMDV vaccine in sheep individuals.
The percent inhibition values obtained with the PrioCHECK and SPCE tests (linear scale) and the VNT titers (inverse of dilutions, log2 scale) are reported over time (D0 to D365) for each sheep, identified with its number. The doubtful and positive thresholds are indicated by dashed lines as in Fig. 1. Sheep were qualified positive responders and represented in red plots when the test values were considered positive in at least 30% of the time points, which is the case in all sheep vaccinated with iFMDV.

