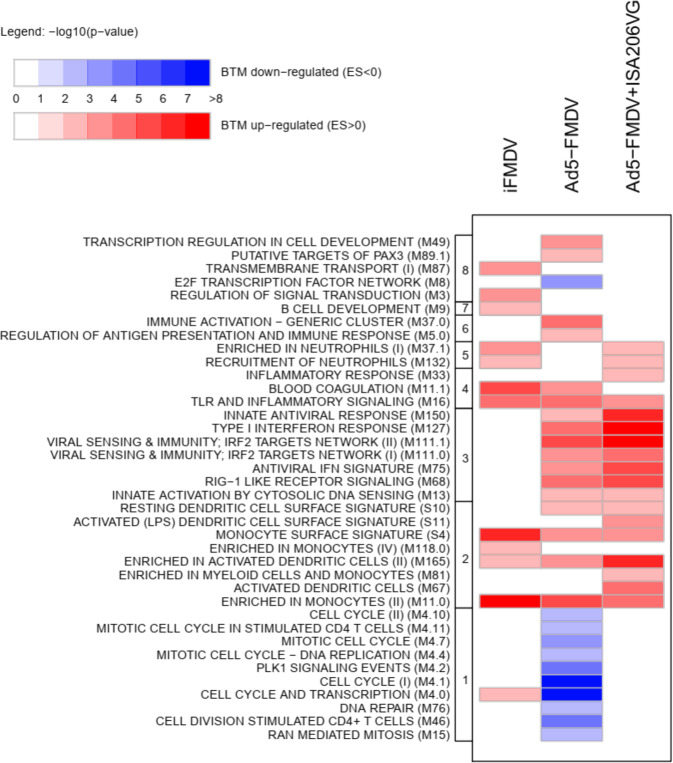
Fig. 5. Modulated BTMs in sheep blood at T24H vs. T0H.
Enriched BTMs were identified from the ranked list of the differentially expressed genes between T24H and T0H in sheep blood post-vaccination. The enrichment p values are represented by graded red (upregulated BTMs) and by graded blue (downmodulated BTMs). BTMs are grouped in functional families (cell cycle (1), mononuclear phagocytes (2), antiviral response (3), inflammation (4), neutrophils (5), immune response (6), B cell (7), cell metabolism (8)).The lists of the enriched BMTs and their statistical values are provided in Supplementary Data Set 2 (iFMDV), Supplementary Data Set 3 (Ad5-FMDV), Supplementary Data Set 4 (Ad5-FMDV+ISA206VG).

