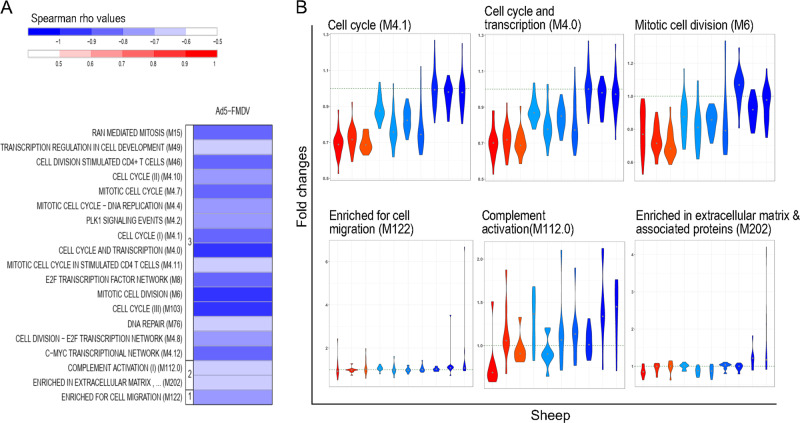
Fig. 7. Transcriptomic signatures of the Ab response magnitude induced by the Ad5-FMDV vaccine.
A PLS algorithm was used to retrieve the genes with fold changes (T24H vs. T0H) related to the PrioCHECK area under the curve. The ranked gene list of the first PLS component was processed through a GSEA to identify enriched BTMs (nominal p value of the GSEA < 0.05, FDR < 0.25). The gene fold changes contributing to each BTM were computed into a single activity score and a Spearman correlation test to VNT was performed across the 10 sheep (p < 0.05). a The BTMs negatively correlating with the Ab response are in graded blue. The BTMs are grouped in functional families (cell migration (1), inflammation (2), cell cycle (3)). b The fold changes of genes contributing to the selected BTM (y-axis) are represented in a violin plot for each sheep which are ordered (x-axis) according to their PrioCHECK area under the curve values (sheep 930, 610, 851, 797, 661, 942, 000, 613, 771, 597). Each sheep was attributed a color within a progressive gradient with red in the maximal responder and blue in the lowest responder (see Fig. 3). Six modulated BTMs, selected on their biological meaning, are illustrated. The list of the selected BMTs and their statistical values is provided in Supplementary Data Set 6 and the list of the genes contributing to the selected BMTs and their fold changes in high and low responders is shown in Supplementary Fig. 4.

