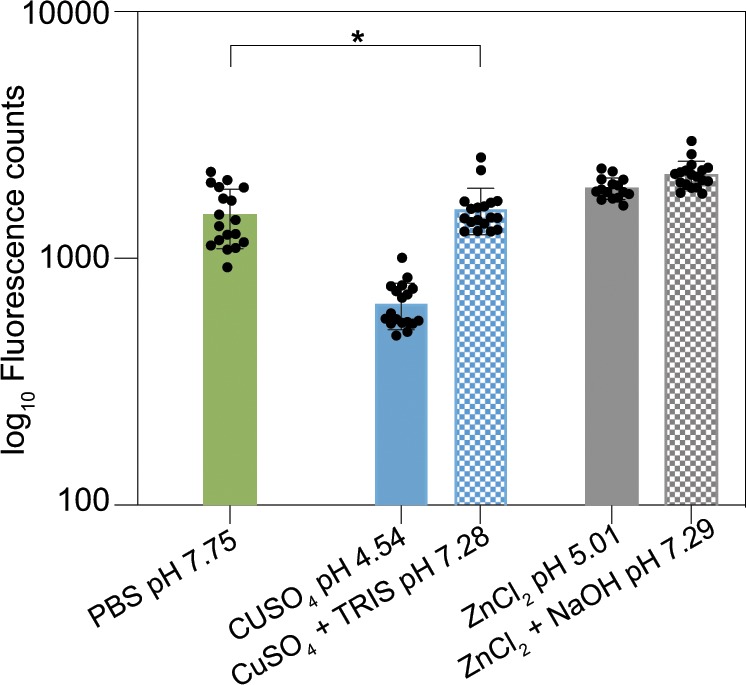
Fig. 4. Effect of acidic pH induced by the addition of metal ion solutions on the fluorescence intensity of purified GFP.

Solid bars represent unaltered solutions, whereas checkered bars represent neutralized solutions. No statistically significant difference was found between the solid green and the solid blue bars, as assessed by a one-way ANOVA with a p value of 0.05 (see Methods). Error bars denote the s.d. as determined from at least 15 individual data points, obtained from a minimum of 5 independent replicates with 3 technical replicates each (N ≥ 5, n = 3).
