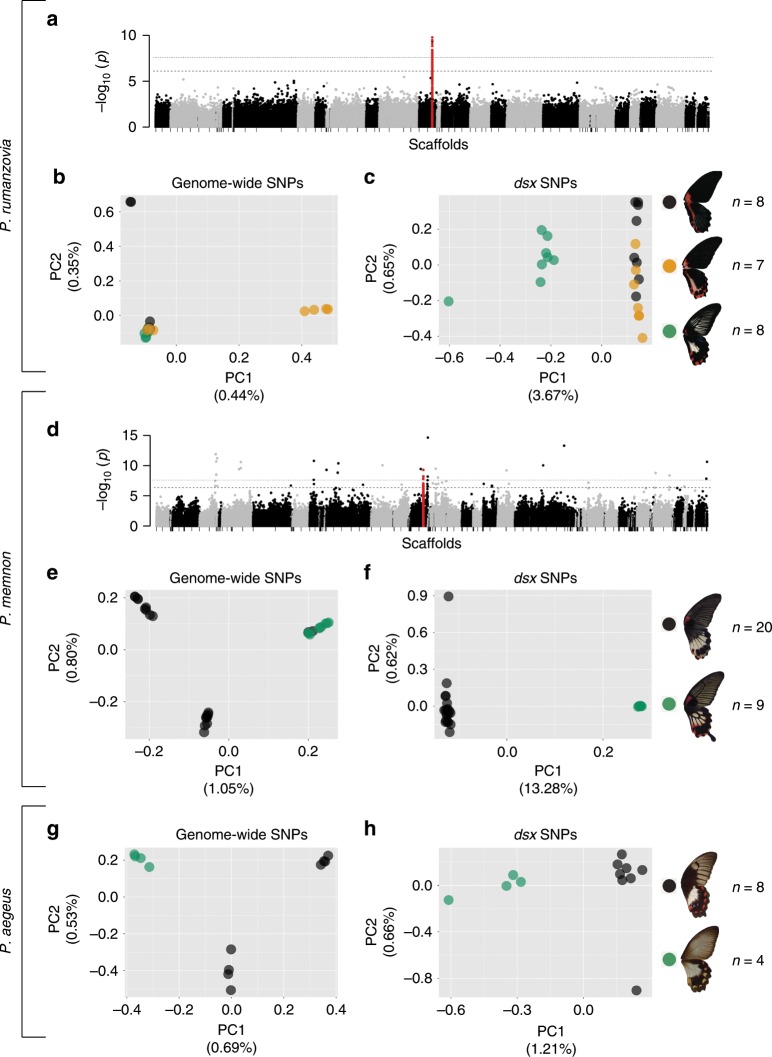
Fig. 2. Identifying mimicry loci in P. rumanzovia, P. memnon, and P. aegeus.
Genome-wide association study (GWAS) for wing patterning in P. rumanzovia (a) and P. memnon (d). Principal component analysis (PCA) based on genome-wide variants for P. rumanzovia (b), P. memnon (e), and P. aegeus (g). PCA based on dsx variants for P. rumanzovia (c), P. memnon (f), and P. aegeus (h). Red points in a and d indicate SNPs in the dsx region. Dashed and dotted lines in a and d show the false discovery rate (q-value) cutoffs of 0.01 and 0.001, respectively.

