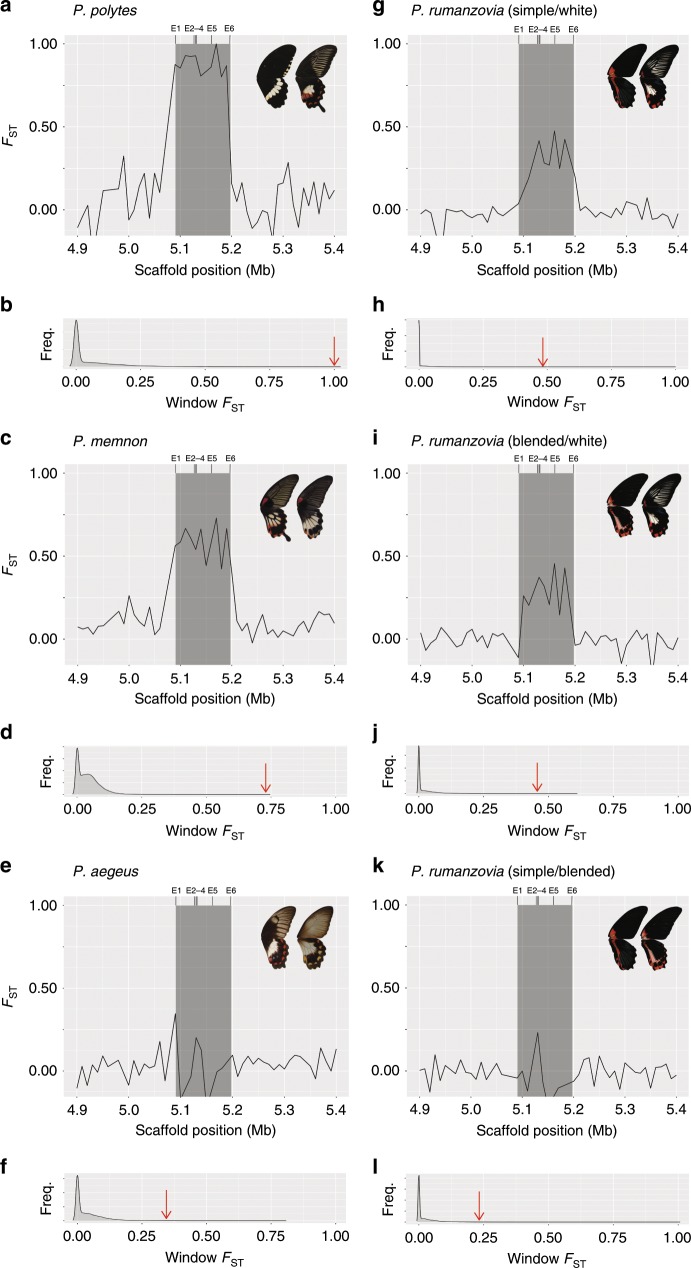
Fig. 3. Genetic differentiation between morphs.
FST across a 500 kb interval containing dsx (gray box) in P. polytes (a), P. memnon (c), P. aegeus (e), and P. rumanzovia (g, i, k). E1–6 indicate the position of dsx exons. Genome-wide FST distribution in P. polytes (b), P. memnon (d), P. aegeus (f), and P. rumanzovia (h, j, l). Red arrows indicate the highest FST value for dsx windows, all of which are in the 99th percentile of their respective distributions.

