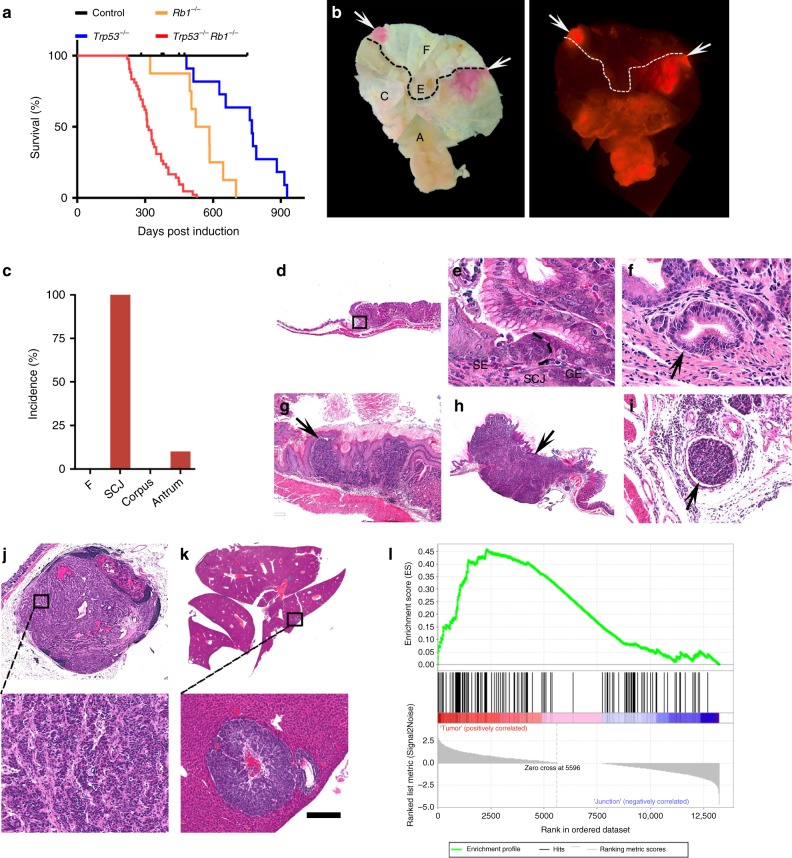
Fig. 1. Inactivation of Trp53 and Rb1 in Lgr5+ cells leads to preferential neoplasia at the gastric SCJ.
a Kaplan–Meier survival curves of Lgr5eGFP−Ires−CreERT2Trp53loxP/loxPRb1loxP/loxPAi9 mice with (Trp53−/−Rb1−/−, n = 42) and without (Control, n = 9) tamoxifen treatment (log-rank test P < 0.0001), and Lgr5eGFP−Ires−CreERT2Trp53loxP/loxPAi9 (Trp53−/−, n = 11) mice and Lgr5eGFP−Ires−CreERT2Rb1loxP/loxPAi9 mice (Rb1−/−, n = 8) treated with tamoxifen (P < 0.001 vs Trp53−/−Rb1−/− mice for both Trp53−/− and Rb1−/−). b tdTomato-expressing (tdTomato+) neoplastic masses (red, arrows) in the stomach of Lgr5eGFP−Ires−CreERT2Trp53loxP/loxPRb1loxP/loxP Ai9 mouse 291 days post induction (p.i.) with tamoxifen. Bright field (left) and fluorescence (right). The punctate lines indicate SCJ line. F forestomach, E esophagus, C corpus, A antrum. c Distribution of neoplasms in stomach regions (n = 20). d, e SCJ between the squamous (SE) and glandular (GE) epithelium in adult Lgr5eGFP−Ires−CreERT2Trp53loxP/loxPRb1loxP/loxPAi9 mouse without tamoxifen induction. Rectangle in d indicates area shown in e. SCJ carcinogenesis in Lgr5eGFP−Ires−CreERT2Trp53loxP/loxPRb1loxP/loxPAi9 mice includes dysplastic glandular lesions (f, arrow, 120 days p.i.), early carcinoma (g, arrow, 177 days p.i.), and advanced carcinoma (h, arrow, 239 days p.i.) with vascular invasion (i). Preferential location of SCJ carcinoma metastases in the lymph node (j, 20% of cases) and the liver (k 35% of cases). Rectangle in top images indicates areas shown in bottom images. l Gene Set Enrichment Analysis of RNA-seq data of mouse gastric SCJ cancers (n = 5) using human gastroesophageal cancer signature genes70. Enrichment score (ES) = 0.46, normalized enrichment score (NES) = 1.38, false discovery rate (FDR) q value = 0.08, P < 0.05. d–k Hematoxylin and eosin staining. Scale bar in k represents 3 mm (b), 1 mm (d and h), 60 μm (e), 40 μm (f), 300 μm (g), 100 μm (i), 600 μm (j top panel), 100 μm (j bottom panel), 4.5 mm (k top panel), and 175 μm (k bottom panel). Source data are provided as a Source Data file.

