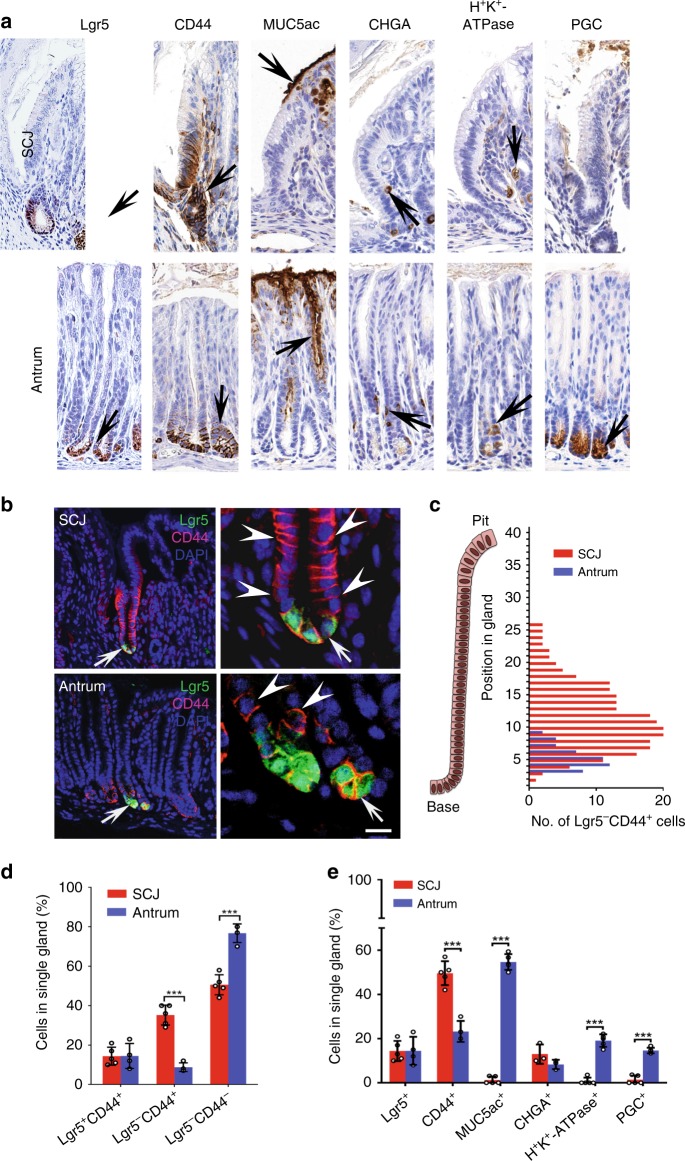
Fig. 2. Comparison of cellular components between gastric SCJ and antrum.
a Detection (brown color, arrows) of cells expressing Lgr5 (Lgr5-eGFP), CD44, and differentiation markers of pit cells (Mucin5AC), neuroendocrine cells (chromogranin A, CHGA), parietal cells (H+K+-ATPase), and chief cells (pepsinogen C, PGC). b Detection of Lgr5-eGFP (green) and CD44 (magenta) in the SCJ and antral epithelium. Arrows in left column images indicate areas shown in right column. Arrows and arrowheads in right column images indicate expression of Lgr5-eGFP and CD44, respectively. c Number of Lgr5−CD44+ cells located at specific positions in glands of SCJ and antrum (n = 20 in each group). d Quantitative analysis of Lgr5+CD44+, Lgr5−CD44+, Lgr5−CD44−, and OPN+ cells at SCJ and antrum (n = 20 in each group). e Quantification of cells expressing Lgr5 (Lgr5-eGFP), CD44, and differentiation markers (n = 3 or more in each group). Elite ABC method (a) and immunofluorescence (b). Counterstaining with hematoxylin (a) and DAPI (b). Scale bar in b represents 40 μm (a), 50 μm (left panels of b), 15 μm (upper right panel of b), and 10 μm (lower right panel of b). **P < 0.01, ***P < 0.001, two-tailed unpaired t-tests. All error bars denote s.d. Source data are provided as a Source Data file.

